. 2025 May 15;12(5):479.
doi: 10.3390/vetsci12050479.

Multi-Omics Unveils Inflammatory Regulation of Fermented Sini Decoction Dregs in Broilers Infected with Avian Pathogenic Escherichia coli

Affiliations

Multi-Omics Unveils Inflammatory Regulation of Fermented Sini Decoction Dregs in Broilers Infected with Avian Pathogenic Escherichia coli

Shuanghao Mo et al. Vet Sci. .

Abstract

Avian colibacillosis causes significant economic losses and raises concerns for human health due to food safety risks, a problem exacerbated by the increase in antibiotic resistance. This study aimed to develop novel antibacterial strategies using fermented liquid of Sini decoction dregs to address these challenges. We analyzed the transcriptome of the chicken thymus sample GSE69014 in the GEO database to identify immune-related genes, performed molecular docking to assess compound interactions, and experimental validation via Western blot and ELISA to evaluate anti-inflammatory effects. Results revealed 11 core genes, including TLR4, critical for immune responses against the infection, with TLR4 activating key inflammatory pathways. Fermented liquid with probiotics enhanced bioactivity, and natural compounds Dioscin and Celastrol from the fermented liquid inhibited inflammation by targeting the TLR4-MD2 complex. In animal models, fermented liquid outperformed individual compounds, likely due to synergistic effects, significantly reducing inflammatory markers. These findings demonstrate that fermented liquid of Sini decoction dregs offers a promising, sustainable approach to control avian colibacillosis, mitigate antibiotic resistance, and improve poultry health, providing a scientific foundation for its application in farming to reduce economic losses and enhance food safety.

Keywords: anti-inflammatory; avian pathogenic Escherichia coli (APEC); fermented liquid of sini decoction dreg (FLSDD).


Conflict of interest statement

The authors declare no conflicts of interest.

Figures

Figure 1
Figure 1
Volcano plot of DEGs group comparison. R represents the resistant phenotype, S represents the susceptible phenotype, and the healthy group is denoted by NC. Log2 Fold Change (Log2FC) represents the logarithm to base 2 of the ratio of gene expression levels under two conditions, indicating the magnitude and direction of differential gene expression. Red dots represent significantly up-regulated genes, and blue dots represent significantly down-regulated genes (|Log2FC| ≥ 0.6 and p ≤ 0.05). Gray dots represent non-significantly changed genes (|Log2FC| < 0.6 or p > 0.05).
Figure 2
Figure 2
(a) The sample dendrogram, showing the similarity between samples through the dendrogram; (b,c) the soft-thresholding selection plot, which illustrates the network’s topological properties under different soft-thresholding powers (soft threshold power, defined as the exponent β applied to the correlation matrix to enhance strong gene correlations and construct a scale-free network). (b) shows the scale independence, indicating how well the network fits a scale-free topology (R2), while (c) displays the mean connectivity index of the scale-free topology model. By selecting an appropriate soft-thresholding power (β = 20 in this analysis), the network can maintain scale-free characteristics and preserve significant correlations between genes. (d) The cluster dendrogram, which displays the clustering of genes, with genes assigned to different modules based on their expression similarities. Different colors at the bottom represent gene modules identified through the dynamic tree cut method, where each color indicates a group of genes that tend to behave similarly. The dendrogram above shows the hierarchical clustering process, with the height on the y-axis reflecting the degree of dissimilarity between genes—taller branches indicate greater differences. The merging of color blocks at the bottom shows how modules are grouped or related to each other based on their gene expression patterns. (e) The module-trait relationships heatmap, which displays the correlation between different gene modules and traits. Each module is represented with a correlation coefficient to the traits, indicated by both color and numerical values. Red represents positive correlation, green represents negative correlation, and the deeper the color, the stronger the correlation. R represents the resistant phenotype, S represents the susceptible phenotype, and the healthy group is denoted by NC.
Figure 3
Figure 3
PPI network and Venn diagram. By comprehensively screening genes from the MEbrown and MEblack modules in WGCNA along with DEGs, a protein–protein interaction network was constructed using the 665 genes shared between them. In this network, larger dark red nodes indicate a higher degree of connectivity within the network, while the redder the edges between nodes, the more reliable the interaction between them (based on the combined score from the STRING database). Conversely, smaller nodes suggest poorer connectivity of that node within the network, and the bluer the edges between nodes, the less reliable their interactions are.
Figure 4
Figure 4
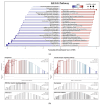
(a) Bidirectional column chart. Displays 48 signaling pathways from the GSEA enrichment analysis based on the KEGG database, with those significantly activated (red) and suppressed (blue) identified (|Normalized Enrichment Score, NES| ≥ 1.5, p ≤ 0.05); (b) Single-gene enrichment analysis result. GSEA results of the six signaling pathways involved in the TLR4, of which the gray ones are insignificant pathways (p ≥ 0.05).
Figure 5
Figure 5
(a) The immune cell stacking chart displays the relative abundance of different types of immune cells in each thymus sample. R represents the resistant phenotype, S represents the susceptible phenotype, and the healthy group is denoted by NC. (b) The correlation heatmap analyzes the relationships between 11 core genes in the PPI network (Figure 3) and 22 types of immune cells using the Spearman correlation coefficient. The heatmap displays the absolute values of the correlation coefficients (|Cor|), highlighting only the significant correlations between genes and immune cells where |Cor| ≥ 0.4 and p ≤ 0.05; (c) shows the differences in the proportion of each group of immune cells. R represents the resistant phenotype, S represents the susceptible phenotype, and the healthy group is denoted by NC. * p < 0.05 and ** p < 0.01 indicate a statistically significant difference from the NC group. (d) Scatter plots showing the association of TLR4 gene expression with M1 and M2 macrophage subsets (calculated using Spearman correlation).
Figure 6
Figure 6
The total ion chromatograms of FLSDD and AE. By matching the results with a database, a total of eight natural compounds targeting TLR4 were identified in LC–MS positive and negative ion modes. As indicated by the numbers in the figure, detailed information of the compounds is shown in Table 3.
Figure 7
Figure 7
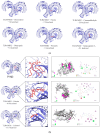
(a) The molecular docking results. The blue part is the protein receptor and the red part is the ligand. Show the binding modes of the TLR4-MD2 complex dimer and six components. (b) Binding interactions of LPS and natural compounds with the TLR4-MD2 complex dimer. The PDB entry 3VQ2 demonstrates the binding interaction between LPS and the TLR4-MD2 complex dimer. Additionally, the binding modes of two natural compounds (Dioscin and Celastrol) with the same protein receptor from 3VQ2 are shown alongside it.
Figure 8
Figure 8
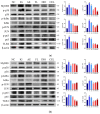
NC denotes the control group, IG denotes the APEC infection group, AE denotes the dregs aqueous extract treatment group, FL denotes the fermented liquid treatment group, and DIO and CEL denote the Dioscin and Celstrol treatment groups, respectively. (a) Protein expression levels in chicken macrophages HD11. (b) Protein expression levels in the chicken duodenum. ## p < 0.01 indicate a statistically significant difference from the NC group; * p < 0.05 and ** p < 0.01 indicate a statistically significant difference from the IG group. WB original figures see Supplementary Materials.
Figure 9
Figure 9
ELISA detection of serum inflammatory factor levels in each treatment group, # p < 0.05 and ## p < 0.01 indicate a statistically significant difference from the NC group; * p < 0.05 and ** p < 0.01 indicate a statistically significant difference from the IG group; NC denotes the control group, IG denotes the APEC infection group, AE denotes the dregs aqueous extract treatment group, FL denotes the fermented liquid treatment group, and DIO and CEL denote the Dioscin and Celstrol treatment groups, respectively.

Similar articles

Cited by

References

    1. Zhao M., Chen Y., Wang C., Xiao W., Chen S., Zhang S., Yang L., Li Y. Systems pharmacology dissection of multi-scale mechanisms of action of Huo-Xiang-Zheng-Qi formula for the treatment of gastrointestinal diseases. Front. Pharmacol. 2019;9:1448. doi: 10.3389/fphar.2018.01448. - DOI - PMC - PubMed
    1. Yao Y., Zhang X., Wang Z., Zheng C., Li P., Huang C., Tao W., Xiao W., Wang Y., Huang L. Deciphering the combination principles of Traditional Chinese Medicine from a systems pharmacology perspective based on Ma-huang Decoction. J. Ethnopharmacol. 2013;150:619–638. doi: 10.1016/j.jep.2013.09.018. - DOI - PubMed
    1. Zhang S., Ding C., Liu X., Zhao Y., Ding Q., Sun S., Zhang J., Yang J., Liu W., Li W. Research progress on extraction, isolation, structural analysis and biological activity of polysaccharides from panax genus. Molecules. 2023;28:3733. doi: 10.3390/molecules28093733. - DOI - PMC - PubMed
    1. Yuan D., Cui Y., Kou Y., Guo X., Chen B. Environmental risk and management of herbal-extraction residues induced by the composition and metal binding properties of DOM. Front. Environ. Sci. 2022;10:856308. doi: 10.3389/fenvs.2022.856308. - DOI
    1. Tao W., Jin J., Zheng Y., Li S. Current advances of resource utilization of herbal extraction residues in China. Waste Biomass Valorization. 2021;12:5853–5868. doi: 10.1007/s12649-021-01428-8. - DOI

LinkOut - more resources