. 2025 Apr 23;17(5):594.
doi: 10.3390/v17050594.

Hsa-miR-7974 Suppresses Epstein-Barr Virus Reactivation by Directly Targeting BZLF1 and BRLF1

Affiliations

Hsa-miR-7974 Suppresses Epstein-Barr Virus Reactivation by Directly Targeting BZLF1 and BRLF1

Haotian Li et al. Viruses. .

Abstract

Epstein-Barr virus (EBV) reactivation, a key factor in Epstein-Barr virus (EBV)-associated malignancies, is regulated by specific cellular microRNAs (miRNAs). This study investigated the role of Hsa-miR-7974 (miR-7974) in this process. miRNA sequencing revealed significant downregulation of miR-7974 in reactivated EBV-positive cell lines (Raji and C666-1). Bioinformatics prediction and dual-luciferase assays confirmed the direct targeting of the EBV immediate-early gene BRLF1 by miR-7974. Furthermore, miR-7974 mimics suppressed, whereas inhibitors increased, the expression of key EBV lytic genes (BZLF1, BRLF1, and BMRF1) and the viral load, as validated by RT-qPCR. Bioinformatics analyses revealed the involvement of miR-7974 in cellular pathways such as membrane dynamics and signal transduction (MAPK, NF-κB, and IL-10), and its association with Hodgkin's lymphoma, leukemia, and nasopharyngeal neoplasms. These findings establish that miR-7974 functions as a crucial negative regulator of EBV reactivation by directly targeting BRLF1, highlighting its potential significance in the pathogenesis of EBV-associated malignancies.

Keywords: Epstein-Barr virus; hsa-miR-7974; lytic cycle; reactivation.


Conflict of interest statement

The authors declare no conflicts of interest.

Figures

Figure 1
Figure 1
TPA and C7 induce EBV lytic replication in Raji and C666-1 cells. Western blot analysis was used to examine the protein expression of ZEBRA (encoded by the BZLF1 gene), an immediate-early marker of EBV lytic reactivation, and Ea-D (encoded by the BMRF1 gene), an early lytic protein. (A) Treatment of Raji cells with TPA for 48 h resulted in increased expression of both ZEBRA and Ea-D. (B) Incubation of C666-1 cells with C7 for 48 h also resulted in elevated ZEBRA and Ea-D protein expression.
Figure 2
Figure 2
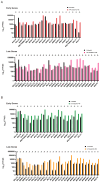
TPA and C7 both induced significant changes in the expression of EBV lytic genes in Raji and C666-1 cells. (A) In Raji cells, the TPA treatment resulted in differential expression of early lytic genes (e.g., BZLF1 and BRLF1) and late lytic genes (e.g., BNRF1 and BALF4), as shown by transcriptomic analysis. (B) Transcriptomic analysis of C666-1 cells treated with C7 also revealed differential expression of similar EBV lytic genes. * represents a p-value < 0.05; ns represents not statistically significant.
Figure 3
Figure 3
Differential expression of miR-7974 during the reactivation of Raji and C666-1 Cells. (A) A volcano plot displaying the statistically significant (p < 0.001) results and showing the relationship between the significance of the miRNAs detected and the fold-change between TPA-treated Raji cells at 48 h and untreated Raji cells. miR-7974 was expressed at lower levels in TPA-treated and untreated Raji cells. (B) Another volcano plot representing miR-7974 showed a lower abundance in C7-treated and untreated C666-1 cells.
Figure 4
Figure 4
Downregulation of miR-7974 in Raji and C666-1 cells at 48 h post-reactivation. (A) Stem-loop reverse transcription quantitative PCR (RT-qPCR) analysis revealed decreased expression of miR-7974 in Raji cells after treatment with TPA. (B) RT-qPCR analysis revealed decreased expression of miR-7974 in C666-1 cells after treatment with C7. * Represents a p-value < 0.05.
Figure 5
Figure 5
This network diagram illustrates the regulatory interactions between cellular miRNAs and key lytic genes of EBV.
Figure 6
Figure 6
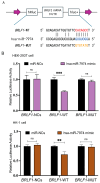
MiR-7974 directly targeted BZLF1 and BRLF1. (A) Matching results between the BRLF1 3′ UTR region and the miR-7974 sequence, including the wild type and mutant type of the matching sequences. (B) Negative control (BRLF1-NCs), wild type (BRLF1-WT), or mutated (BRLF1-MUT) plasmids were co-transfected with miR-7974 mimics or miR-NCs into HEK293T cells and HK-1 cells. The luciferase activity was measured for 24 h. Statistical analysis was performed with the analysis of variance. *** represents a p-value < 0.001; ** represents a p-value < 0.01; ns represents not statistically significant.
Figure 7
Figure 7
MiR-7974 significantly suppresses EBV lytic gene expression in C666-1 cells. Reverse transcription quantitative PCR (RT-qPCR) was conducted to confirm the significant downregulation of the EBV immediate-early gene BZLF1, BRLF1, and early gene BMRF1, following transfection with the miR-NC (negative control), the miR-7974 mimic, and the miR-7974 inhibitor. **** Represents a p-value < 0.0001; ** represents a p-value < 0.01.
Figure 8
Figure 8
Viral load quantification in response to miR-7974 mimic and inhibitor transfection. (A) A standard curve was generated by plotting the cycle threshold (Ct) values against the log of EBV DNA concentrations (R2 > 0.99). (B) Compared with the miR-NC control group, the miR-7974 mimic group presented a marked reduction in the EBV viral load (p = 0.004), whereas the miR-7974 inhibitor group presented a significant increase (p = 0.007). ** Represents a p-value < 0.01.
Figure 9
Figure 9
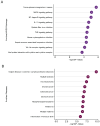
Pathway and disease enrichment analysis of miR-7974 target genes, along with the functional cluster network of these targets. (A) Lollipop plots show the significantly enriched signaling pathways of the validated targets of miR-7974. (B) Lollipop plots show the significantly enriched diseases associated with the validated targets of miR-7974. (C) The GO enrichment analysis network shows the functional clustering of target genes of miR-7974 via the ClueGO and CluePedia plugins in the Cytoscape software 3.10.3.
Figure 9
Figure 9
Pathway and disease enrichment analysis of miR-7974 target genes, along with the functional cluster network of these targets. (A) Lollipop plots show the significantly enriched signaling pathways of the validated targets of miR-7974. (B) Lollipop plots show the significantly enriched diseases associated with the validated targets of miR-7974. (C) The GO enrichment analysis network shows the functional clustering of target genes of miR-7974 via the ClueGO and CluePedia plugins in the Cytoscape software 3.10.3.

Similar articles

References

    1. Young L.S., Yap L.F., Murray P.G. Epstein-Barr virus: More than 50 years old and still providing surprises. Nat. Rev. Cancer. 2016;16:789–802. doi: 10.1038/nrc.2016.92. - DOI - PubMed
    1. Dunmire S.K., Verghese P.S., Balfour H.H., Jr. Primary Epstein-Barr virus infection. J. Clin. Virol. 2018;102:84–92. doi: 10.1016/j.jcv.2018.03.001. - DOI - PubMed
    1. Brady G., MacArthur G.J., Farrell P.J. Epstein–Barr virus and Burkitt lymphoma. Postgrad. Med. J. 2008;84:372–377. doi: 10.1136/jcp.2007.047977. - DOI - PubMed
    1. Carbone A., Gloghini A. Epstein Barr Virus-Associated Hodgkin Lymphoma. Cancers. 2018;10:163. doi: 10.3390/cancers10060163. - DOI - PMC - PubMed
    1. Schober T., Framke T., Kreipe H., Schulz T.F., Grosshennig A., Hussein K., Baumann U., Pape L., Schubert S., Wingen A.M., et al. Characteristics of early and late PTLD development in pediatric solid organ transplant recipients. Transplantation. 2013;95:240–246. doi: 10.1097/TP.0b013e318277e344. - DOI - PubMed

MeSH terms

LinkOut - more resources