. 2025 Apr 23;17(5):597.
doi: 10.3390/v17050597.

A Novel Toolkit of SARS-CoV-2 Sub-Genomic Replicons for Efficient Antiviral Screening

Affiliations

A Novel Toolkit of SARS-CoV-2 Sub-Genomic Replicons for Efficient Antiviral Screening

Maximilian Erdmann et al. Viruses. .

Abstract

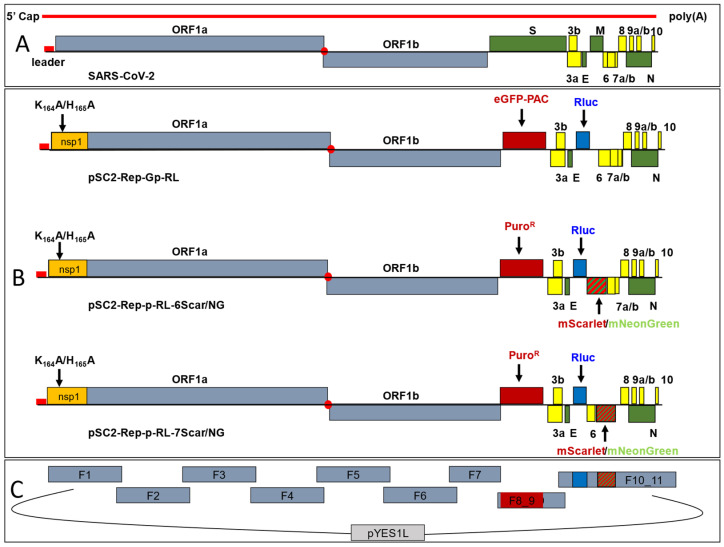
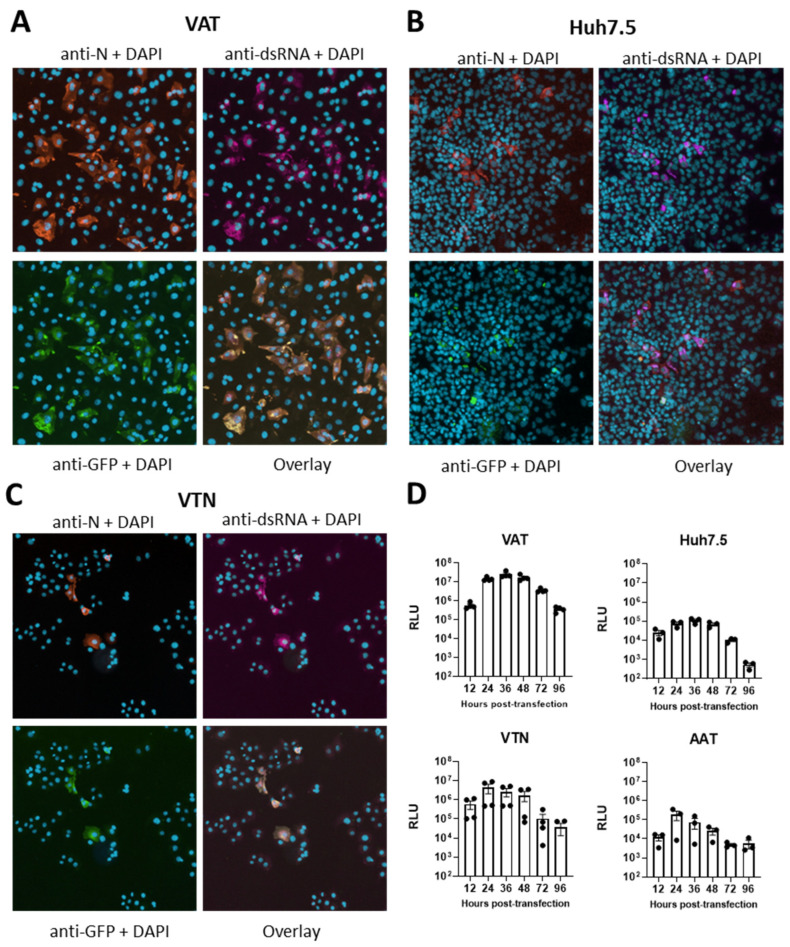
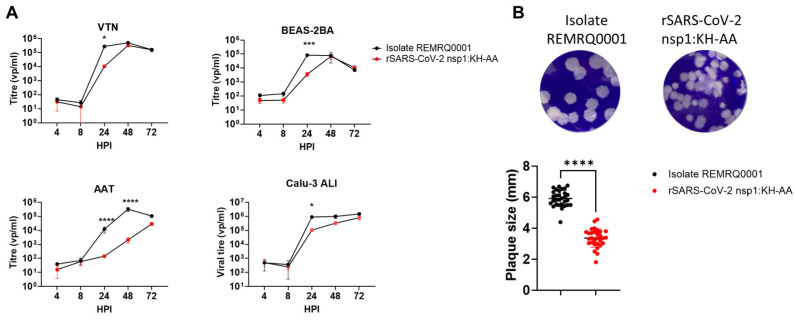
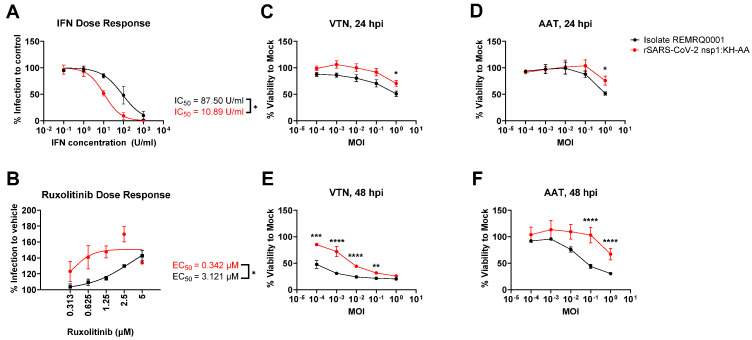
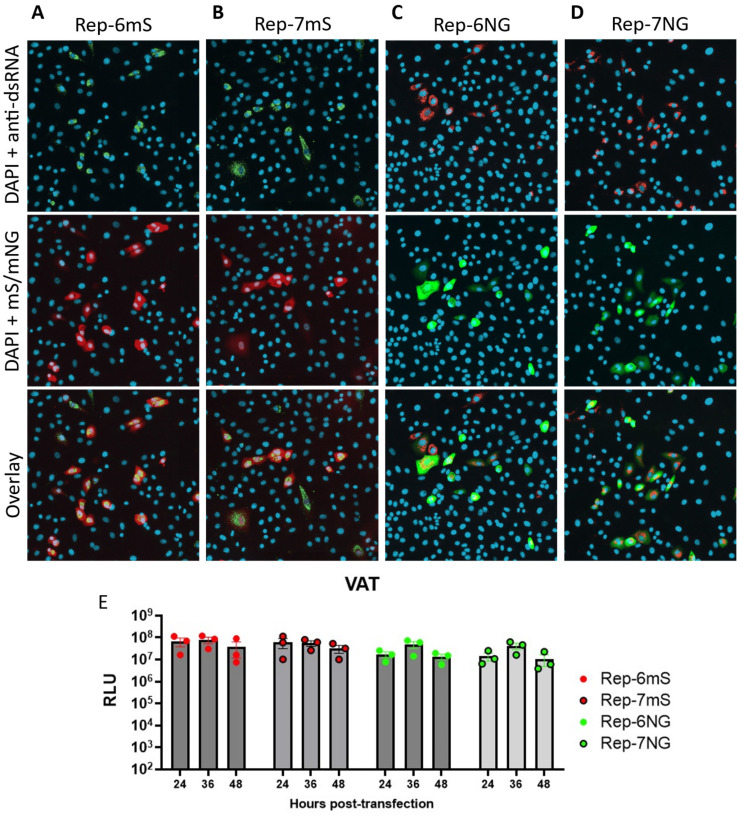
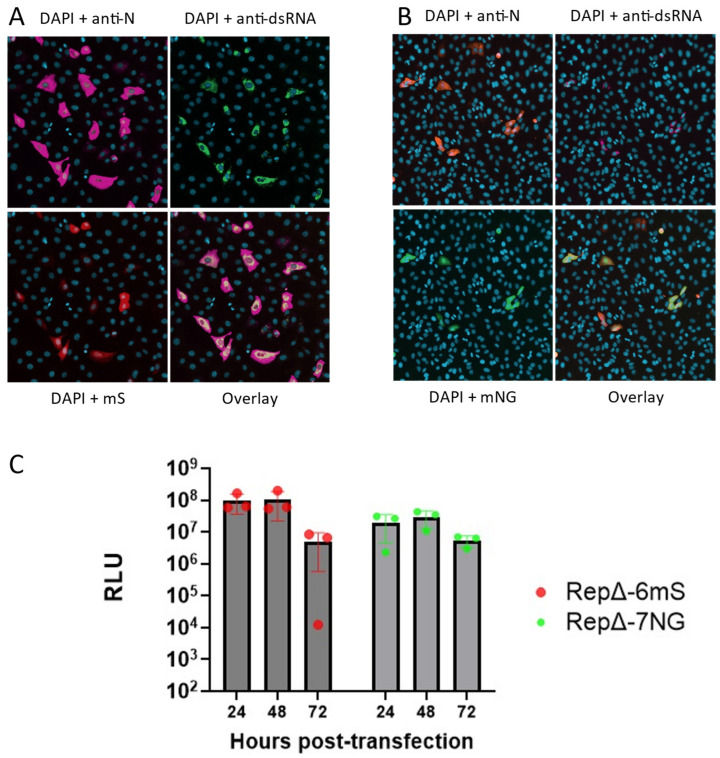
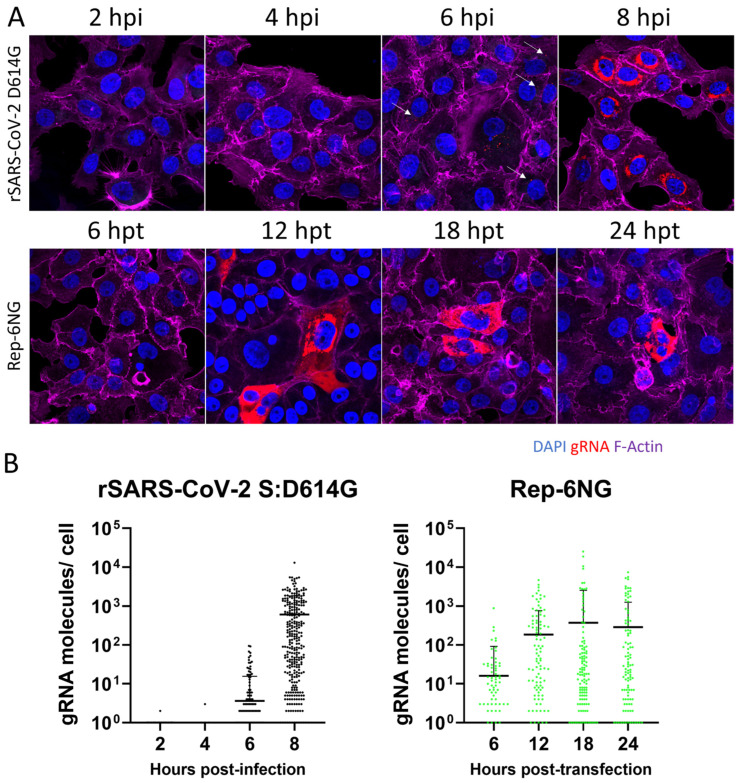
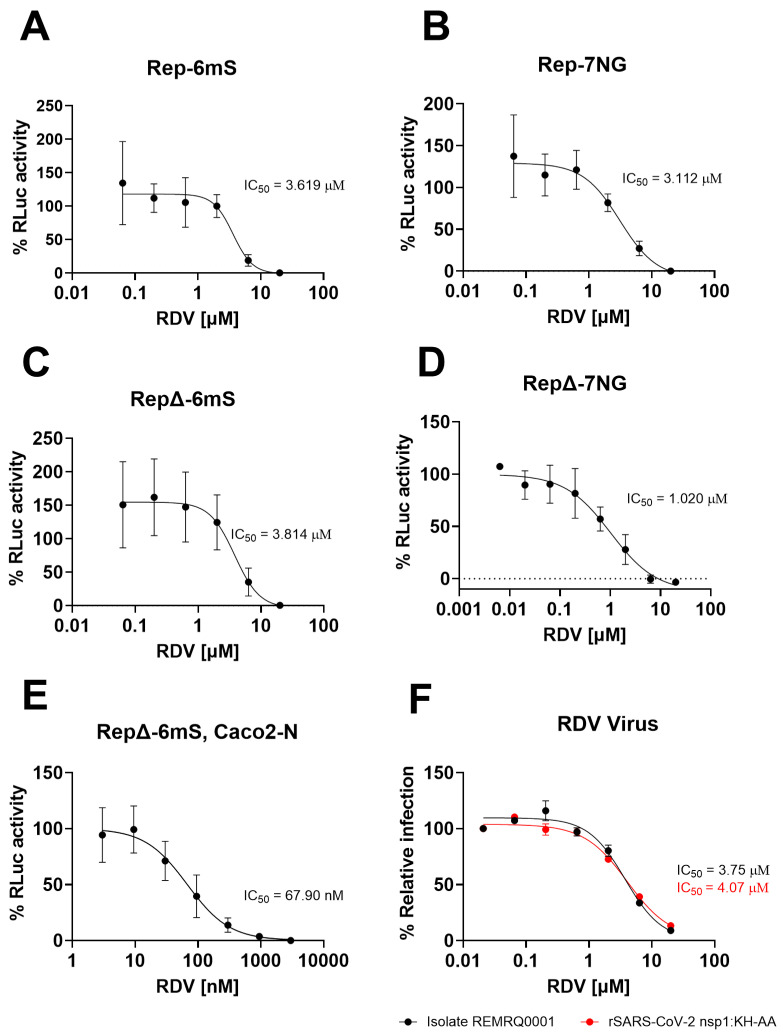
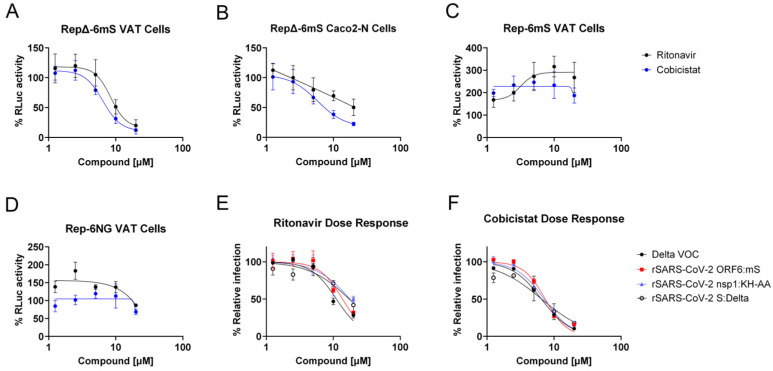
SARS-CoV-2 is classified as a containment level 3 (CL3) pathogen, limiting research access and antiviral testing. To address this, we developed a non-infectious viral surrogate system using reverse genetics to generate sub-genomic replicons. These replicons contained the nsp1 mutations K164A and H165A and had the spike, membrane, ORF6, and ORF7a coding sequences replaced with various reporter and selectable marker genes. Replicons based on the ancestral Wuhan Hu-1 strain and the Delta variant of concern were replication-competent in multiple cell lines, as assessed by Renilla luciferase activity, fluorescence, immunofluorescence staining, and single-molecule fluorescent in situ hybridization. Antiviral assays using transient replicon expression showed that remdesivir effectively inhibited both replicon and viral replication. Ritonavir and cobicistat inhibited Delta variant replicons similarly to wild-type virus but did not inhibit Wuhan Hu-1 replicon replication. To further investigate the impact of nsp1 mutations, we generated a recombinant SARS-CoV-2 virus carrying the K164A and H165A mutations. The virus exhibited attenuated replication across a range of mammalian cell lines, was restricted by the type I interferon response, and showed reduced cytopathic effects. These findings highlight the utility of sub-genomic replicons as reliable CL2-compatible surrogates for studying SARS-CoV-2 replication and drug activity mechanisms.

Keywords: RNA replicon; SARS-CoV-2; SARS-CoV-2 nsp1; antiviral.


Conflict of interest statement

The authors declare no conflicts of interest.

Figures

Figure 1
Figure 1
Construction of SARS-CoV-2 replicon clones. (A) Schematic of the SARS-CoV-2 genome and ORFs. (B) Replicon cDNA BAC/YAC constructs. For pSC2-Rep-Gp-RL, the S and M genes were replaced with sequences encoding an eGFP-pac fusion protein and RLuc, respectively. Mutations encoding amino acid changes K164A/H165A were introduced into the nsp1 sequence. pSC2-Rep-Gp-RL was modified further by replacing the eGFP-pac sequence with the pac gene coding sequence alone (PuroR) and ORF6 and ORF7a with either the mNeonGreen or mScarlet coding sequences, resulting in the pSC2-Rep-p-RL-6Scar/NG and pSC2-Rep-p-RL-7Scar/NG replicon clones, respectively. (C) TAR assembly of replicon cDNA genomes. Overlapping cDNA fragments spanning the genome with 70 bp terminal end-homology were assembled into BAC/YAC shuttle vector pYES1L. Fragments F8_9 and F10_11 contain replicon-specific gene replacements.
Figure 2
Figure 2
Characterisation of replicon Rep-Gp-RL replication (AC). Immunofluorescence assay of replicon transfected cells. (A) VAT, (B) Huh 7.5 and (C) VTN cells were transfected with in vitro RNA transcripts corresponding to Rep-Gp-RL and N gene constructs. Cells shown in the top panels were stained with antibodies recognising the SARS-CoV-2 N protein and dsRNA with nuclear DNA identified by DAPI staining. Bottom panels show staining with an antibody recognising eGFP, nuclear DNA stained with DAPI and a four-colour overlay. (D) VAT, Huh 7.5, VTN and AAT cells were transfected with Rep-Gp-RL RNA transcripts and N gene constructs. At the indicated times post-transfection, the cells were lysed, and the lysates assayed for RLuc activity. Luminescence of each sample was adjusted for background by subtracting a cell-only control. Graphs show the mean and standard error of the mean (SEM) of n = 3–4 biological repeats.
Figure 3
Figure 3
(A) Replication kinetics of rSARS-CoV-2 nsp1:KH-AA and wild-type SARS-CoV-2 isolate REMRQ0001 in VTN, BEAS-2BA, AAT and Calu-3 cells. Graphs show mean and SEM of n = 3 biological repeats. Statistical analysis was performed using two-Way ANOVA with * < 0.05, *** < 0.0002 and **** < 0.0001. (B) Plaque morphology of rSARS-CoV-2 nsp1-KH-AA and REMRQ0001 in VTN cells. Representative image of plaques formed by each virus. Using Fiji, the diameter of 10 plaques in three biological repeats was quantified. An unpaired t-test was performed, with p < 0.05 shown as *.
Figure 4
Figure 4
(A) Dose response assay of rSARS-CoV-2 nsp1:KH-AA and SARS-CoV-2 REMRQ0001 to IFN-α. VTN cells were pre-treated for 18 h with the indicated concentrations. Cells were then washed before infection at MOI 0.01, washed and incubated in infection media. At 24 hpi, cells were fixed and relative infection was determined by immunofluorescence staining of N and DAPI staining. The graph shows the mean and SEM of n = 3 biological replicates. (B) Drug response assay of rSARS-CoV-2 nsp1:KH-AA and REMRQ0001 to the JAK-STAT pathway inhibitor ruxolitinib. AAT cells were pre-treated for 2 h with the indicated concentrations. Cells were then infected at MOI 0.025, washed and incubated with the indicated concentration for 24 h. Relative infection was determined by immunofluorescence of N and DAPI staining. The graph shows the mean and SEM of n = 3 biological replicates. Statistical analysis comparing REMRQ0001 vs. rSARS-CoV-2 nsp1:KH-AA was performed using a two-way ANOVA, with significance taken as p-value < 0.05, represented as *. (CF) Cellular viability assay in VTN and AAT cells comparing REMRQ0001 and rSARS-CoV-2 nsp1:KH-AA. VTN or AAT cells were infected at the indicated MOIs and incubated for 24- or 48-hpi. At each time-point, an MTT assay was performed to determine the viability of the infected cultures, normalising cell viability to the uninfected control. Statistical analysis comparing REMRQ0001 vs. rSARS-CoV-2 nsp1:KH-AA was performed using a two-way ANOVA, with significance taken as p-value < 0.05, represented as ** = 0.0098, *** = 0.0001, **** < 0.0001.
Figure 5
Figure 5
Characterisation of second-generation SARS-CoV-2 replicons. (AD) Immunofluorescence assay of replicon transfected cells. Detection of mScarlet, mNeonGreen and dsRNA after transfection of in vitro RNA transcripts derived from dual reporter replicons. VAT cells were transfected with in vitro RNA transcripts corresponding to (A) Rep-6mS, (B) Rep-7mS, (C) Rep-6NG and (D) Rep-7NG and an N gene construct. Cells in the top panels were stained for dsRNA and nuclear DNA (DAPI). The middle panels show fluorescence from the mScarlet (mS) and mNeonGreen (mNG) proteins and DAPI staining of nuclear DNA, whilst the bottom panels show a three-colour overlay. Fluorescence from the reporter proteins was acquired using an ImageExpressPico microscope. (E) Luciferase kinetics of second-generation replicons. Rluc activity after transfection of in vitro RNA transcripts derived from dual reporter replicons. VAT cells were transfected with in vitro RNA transcripts corresponding to Rep-6mS, Rep-7mS, Rep-6NG, Rep-7NG and an N gene construct. At the indicated times post-transfection, the cells were assayed for RLuc activity. The sample luminescence was adjusted for assay background by subtracting the cell-only control. Graphs show mean and SEM of n = 3 biological replicates.
Figure 6
Figure 6
Validation of the replication of in vitro RNA transcripts derived from SARS-CoV-2 Delta VOC replicons. (A,B) Immunofluorescence assay of replicon transfected cells. VAT cells were transfected with in vitro RNA transcripts corresponding to (A) RepΔ-6mS and (B) RepΔ-7NG, respectively, and an N gene construct. At 24 hpt, a portion of the cells was fixed and stained with antibodies recognising the N protein and dsRNA and examined for fluorescence from (A) mScarlet, (B) mNeonGreen and DAPI stained nuclear DNA. The bottom right panels show a three-colour overlay. Fluorescence from the reporter proteins was acquired using an ImageExpressPico microscope. (C) Luciferase kinetics of second-generation Delta replicons. Expression of RLuc in VAT cells transfected with in vitro RNA transcripts corresponding to RepΔ-6mS and RepΔ-7NG was monitored over the period of 24–72 hpt. The sample luminescence was adjusted for assay background by subtracting the cell-only control. Graphs show mean and SEM of n = 3 biological repeats.
Figure 7
Figure 7
smFISH RNA copy kinetics of rSARS-CoV-2 S:D614G and Rep-6NG in VTN cells. (A) VTN cells were grown on coverslips and infected at MOI 3 with rSARS-CoV-2 S:D614G or transfected with 10 µg in vitro RNA transcripts corresponding to Rep-6NG as described and seeded onto coverslips. The image shows representative infected/transfected cells fixed at the selected hpi/hpt, respectively, and stained for F-actin, gRNA and nuclear DNA. White arrows indicate viral gRNA (B). Quantification of SARS-CoV-2 viral and replicon gRNA molecules/cell was performed using FISH-quant/big-fish and data points show the average count of 5–10 fields of view, with 3–5 cells sampled/area.
Figure 8
Figure 8
Replicons and rSARS-CoV-2 nsp1:KH-AA are dose-responsive to remdesivir. (AD) Replicon dose–response curves to remdesivir. VAT cells were transfected with in vitro RNA transcripts corresponding to (A) Rep-6mS, (B) Rep-7NG, (C) RepΔ-6mS and (D) RepΔ-7NG and an N gene transcript. (E) Caco2-N cells were transfected with in vitro RNA transcripts corresponding to RepΔ-6mS and an N gene transcript. The transfected cells were incubated with a half-log fold dilution series of remdesivir, starting at 20 µM. At 24 hpt the cells were lysed and assayed for RLuc activity. The graphs show mean and standard deviation as a percentage of the dimethyl sulfoxide (DMSO) control, adjusted for background. (F) Dose–response curve of REMRQ0001 and rSARS-CoV-2 nsp1:KH-AA to remdesivir. VTN cells were infected with REMRQ0001 and rSARS-CoV-2 nsp1-KH-AA at MOI 0.5. The infected cells were incubated for 18 h with a half-log dilution series of remdesivir starting at 20 μM. Relative infection was determined by immunofluorescence and expressed as a percentage of the DMSO vehicle. IC50 values were determined in GraphPad Prism (Version 10.2.3, Boston, MA, USA).
Figure 9
Figure 9
Dose–response assays with ritonavir and cobicistat. VAT (A,C,D) and Caco2- N cells (B) were transfected with 2 µg of N-gene transcripts and 10 µg replicon transcripts as indicated. Cells were then seeded and incubated with a two-fold five-point dilution series of drug, starting at 20 µM. At 24 hpt, the cells were lysed and analysed for RLuc activity. The RLuc activity was then expressed as a percentage of the DMSO vehicle control. The graphs show mean and standard deviation of n = 3–4 biological repeats. (E,F) VTN cells were infected with the indicated SARS-CoV-2 viruses at MOI 0.5. The infected cells were incubated for 18 h with two-fold dilution series of each drug starting at 20 μM. Relative infection was determined by immunofluorescence and expressed as a percentage of the DMSO vehicle. IC50 values were determined in GraphPad Prism (Version 10.2.3, Boston, MA, USA).

Similar articles

References

    1. Gorbalenya A.E., Baker S.C., Baric R.S., De Groot R.J., Drosten C., Gulyaeva A.A., Haagmans B.L., Lauber C., Leontovich A.M., Neuman B.W., et al. Coronaviridae Study Group of the International Committee on Taxonomy of V. The species Severe acute respiratory syndrome-related coronavirus: Classifying 2019-nCoV and naming it SARS-CoV-2. Nat. Microbiol. 2020;5:536–544. - PMC - PubMed
    1. Wu F., Zhao S., Yu B., Chen Y.-M., Wang W., Song Z.-G., Hu Y., Tao Z.-W., Tian J.-H., Pei Y.-Y., et al. A new coronavirus associated with human respiratory disease in China. Nature. 2020;579:265–269. doi: 10.1038/s41586-020-2008-3. - DOI - PMC - PubMed
    1. Zhou P., Yang X.-L., Wang X.-G., Hu B., Zhang L., Zhang W., Si H.-R., Zhu Y., Li B., Huang C.-L., et al. A pneumonia outbreak associated with a new coronavirus of probable bat origin. Nature. 2020;579:270–273. doi: 10.1038/s41586-020-2012-7. - DOI - PMC - PubMed
    1. Zhu N., Zhang D., Wang W., Li X., Yang B., Song J., Zhao X., Huang B., Shi W., Lu R., et al. A novel coronavirus from patients with pneumonia in China, 2019. N. Engl. J. Med. 2020;382:727–733. doi: 10.1056/NEJMoa2001017. - DOI - PMC - PubMed
    1. Liu Y., Yang Y., Zhang C., Huang F., Wang F., Yuan J., Wang Z., Li J., Li J., Feng C., et al. Clinical and biochemical indexes from 2019-nCoV infected patients linked to viral loads and lung injury. Sci. China Life Sci. 2020;63:364–374. doi: 10.1007/s11427-020-1643-8. - DOI - PMC - PubMed

Publication types

Substances

LinkOut - more resources