. 2025 May 9;25(10):2987.
doi: 10.3390/s25102987.

Time-Frequency Analysis of Motor Imagery During Plantar and Dorsal Flexion Movements Using a Low-Cost Ankle Exoskeleton

Affiliations

Time-Frequency Analysis of Motor Imagery During Plantar and Dorsal Flexion Movements Using a Low-Cost Ankle Exoskeleton

Cristina Polo-Hortigüela et al. Sensors (Basel). .

Abstract

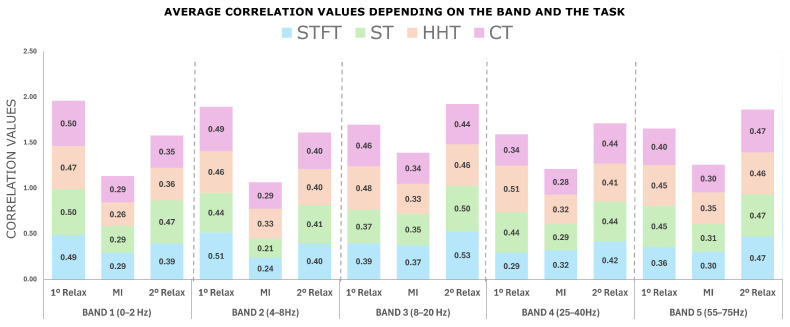
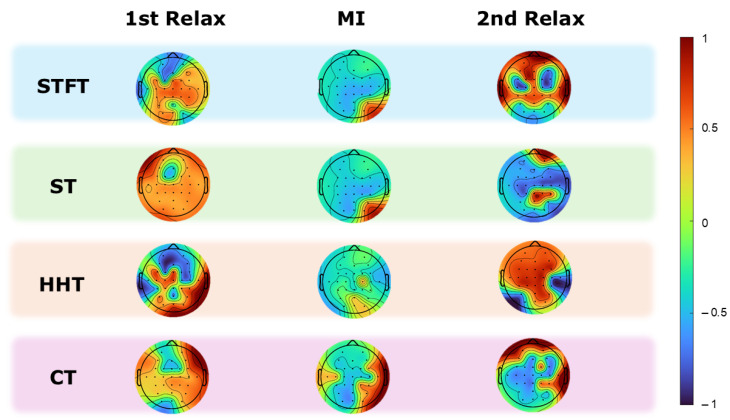
Sensor technology plays a fundamental role in neuro-motor rehabilitation by enabling precise movement analysis and control. This study explores the integration of brain-machine interfaces (BMIs) and wearable sensors to enhance motor recovery in individuals with neuro-motor impairments. Specifically, different time-frequency transforms are evaluated to analyze the correlation between electroencephalographic (EEG) activity and ankle position, measured by using inertial measurement units (IMUs). A low-cost ankle exoskeleton was designed to conduct the experimental trials. Six subjects performed plantar and dorsal flexion movements while the EEG and IMU signals were recorded. The correlation between brain activity and foot kinematics was analyzed using the Short-Time Fourier Transform (STFT), Stockwell (ST), Hilbert-Huang (HHT), and Chirplet (CT) methods. The 8-20 Hz frequency band exhibited the highest correlation values. For motor imagery classification, the STFT achieved the highest accuracy (92.9%) using an EEGNet-based classifier and a state-machine approach. This study presents a dual approach: the analysis of EEG-movement correlation in different cognitive states, and the systematic comparison of four time-frequency transforms for both correlation and classification performance. The results support the potential of combining EEG and IMU data for BMI applications and highlight the importance of cognitive state in motion analysis for accessible neurorehabilitation technologies.

Keywords: brain–machine interface (BMI); electroencephalography (EEG); inertial measurement units (IMUs); low-cost exoskeleton; motor imagery; neurorehabilitation; time-frequency transforms.


Conflict of interest statement

The authors declare no conflicts of interest.

Figures

Figure 1
Figure 1
On the left side of the image, the distribution of the electrodes utilized in this research can be observed. The electrodes utilized for signal processing are indicated by a green highlight. Additional electrodes used for EEG signal acquisition are highlighted in blue. The image on the right illustrates the distribution of the EOG electrodes on the faces of the subjects. Two electrodes (VU, VD) are positioned vertically between the eyes to capture blinks. The remaining electrodes (HR, HL) are positioned laterally between the two eyes to capture horizontal movements. On the right ear, a reference (highlighted in orange) is positioned as a clamp.
Figure 2
Figure 2
Three-dimensional design of the developed ankle exoskeleton. The modular design with its three main elements is easily distinguishable.
Figure 3
Figure 3
The following image shows the arrangement of the subject and the materials used in one of the experiments. The computer with the developed BMI architecture is located on the left side. In addition, the rest of the elements such as the EEG cap data reception base and the loudspeakers for the auditory indicators are shown. In the middle of the picture, the subject is seated on a stretcher. The EEG cap and the EOG electrodes are located on the head. The ankle exoskeleton is located on the user’s dominant leg. The left-hand side shows the three positions of the exoskeleton. It starts from an initial position (home) to perform a dorsal flexion. It then returns to the home position to initiate a plantar flexion. When this movement is finished, it returns to the home position. All this is performed cyclically until it receives the order to stop.
Figure 4
Figure 4
This image shows the protocol followed in the open-loop tests of this research. The blue color shows the order and duration of motion trials. The same but in green for the static trials. The only difference between the two types of trials is that after the H Infinity period, the exoskeleton performs cyclic movements of PF and DF only in motion trials. Motion and static trials alternate until 11 of each are completed. All mental tasks are preceded by an auditory cue in the form of a voice.
Figure 5
Figure 5
This figure describes a general outline of the working process of this research. The study starts with the acquisition of data by performing six experimental tests. After that, the signal is de-artifacted by using hardware filters and software. For signal processing, the different frequency-time transforms are used. The purpose of all this is to obtain the Instantaneous Energy Density Level. Prior to this, a standardization of the frequency bands to be used is carried out. Finally, the two lines of research are proposed. On the one hand, we study the analysis of the correlation between the position of the foot and the EEG signal. On the other hand, we perform decoding of the motor imagination. For the first study, only the motion model data as well as the unnormalized data are used. For the second study, the normalized data as well as the data from both the motion and static trials are used.
Figure 6
Figure 6
Three signals can be seen in (A). The blue signal is the variation of the instantaneous power in a section of the first relaxation for one electrode and for one subject. The black continuous signal is the position marked by the IMU of the foot position. The black dashed signal is the signal ahead of the same lag value where the maximum correlation value has been given. The star represents the delay between both signals. In (B), look at the correlation values between the two signals for different lags. The blue lines represent the statistical significance threshold for the cross–correlation function. In this example, the maximum correlation value is observed for a lag of −184 samples (indicated with the star), which is the same as the one shifted in (A). It is noticeable that there is some negative correlation between the EEG signal and the IMU signal.
Figure 7
Figure 7
This figure shows the average correlation values of the 15 electrodes obtained for each frequency band and for each mental task section. In blue, data corresponding to STFT, in green to ST, in orange to HHT and in pink to CT. It can be seen that the band with the greatest difference between the relaxation and motor imagination sections is the band corresponding to 4–8 Hz. It is also noticeable that the band with the best correlation values is the 8–20 Hz band, with STFT and HHT having the highest average values.
Figure 8
Figure 8
This figure is divided horizontally by the three frequency-time methods used in this research. It is also divided vertically by the three mental tasks performed in the experiments. The topoplots show the correlation values obtained for all electrodes for subject S2 and for the frequency band 8–20 Hz. It is clearly distinguishable how there is a change in the value of the correlations between the relaxation sections, whose values tend to increase, and between the motor imagination section, which tends to decrease.
Figure 9
Figure 9
This figure shows the average lag values for each frequency band. These values for all frequency bands are around 2 s. It is noticeable that the frequency band with the lowest lag value is the 4–8 Hz band. This band was the same band where the correlation differences between MI and Relax were the highest.

References

    1. He Y., Eguren D., Azorín J.M., Grossman R.G., Luu T.P., Contreras-Vidal J.L. Brain-machine interfaces for controlling lower-limb powered robotic systems. J. Neural Eng. 2018;15:021004. doi: 10.1088/1741-2552/aaa8c0. - DOI - PubMed
    1. King C.E., Wang P.T., Chui L.A., Do A.H., Nenadic Z. Operation of a brain-computer interface walking simulator for individuals with spinal cord injury. J. Neuroeng. Rehabil. 2013;10:77. doi: 10.1186/1743-0003-10-77. - DOI - PMC - PubMed
    1. Yang H., Guan C., Wang C.C., Ang K.K. Detection of motor imagery of brisk walking from electroencephalogram. J. Neurosci. Methods. 2015;244:33–44. doi: 10.1016/j.jneumeth.2014.05.007. - DOI - PubMed
    1. Ferrero L., Ortiz M., Quiles V., Iáñez E., Flores J.A., Azorín J.M. Brain symmetry analysis during the use of a BCI based on motor imagery for the control of a lower-limb exoskeleton. Symmetry. 2021;13:1746. doi: 10.3390/sym13091746. - DOI
    1. Shyam A.K.B., Wadhwani Investigation of the Impact of EEG Signal Processing Techniques on Classification Performance. In: Kumar Singh K., Singh S., Srivastava S., Bajpai M.K., editors. Proceedings of the Machine Vision and Augmented Intelligence; Patna, India. 24–25 November 2023; Singapore: Springer Nature; 2023. pp. 265–283.

LinkOut - more resources