. 2025 Jul 1;124(13):2161-2175.
doi: 10.1016/j.bpj.2025.05.018. Epub 2025 May 26.

Microtubule polymerization generates microtentacles important in circulating tumor cell invasion

Affiliations

Microtubule polymerization generates microtentacles important in circulating tumor cell invasion

Lucina Kainka et al. Biophys J. .

Abstract

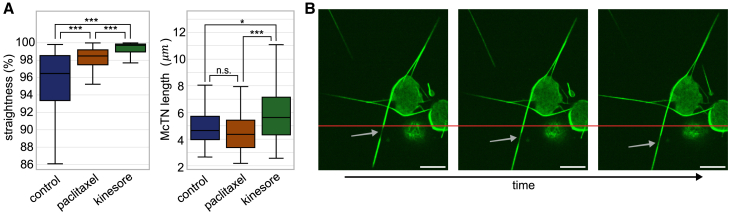
Circulating tumor cells (CTCs) have crucial roles in the spread of tumors during metastasis. A decisive step is the extravasation of CTCs from the blood stream or lymph system, which depends on the ability of cells to attach to vessel walls. Recent work suggests that such adhesion is facilitated by microtubule (MT)-based membrane protrusions called microtentacles (McTNs). However, how McTNs facilitate such adhesion and how MTs can generate protrusions in CTCs remain unclear. By combining fluorescence recovery after photobleaching experiments and simulations we show that polymerization of MTs provides the main driving force for McTN formation, whereas the contribution of MTs sliding with respect to each other is minimal. Further, the forces exerted on the McTN tip result in curvature, as the MTs are anchored at the other end in the MT organizing center. When approaching vessel walls, McTN curvature is additionally influenced by the adhesion strength between the McTN and wall. Moreover, increasing McTN length, reducing its bending rigidity, or strengthening adhesion enhances the cell-wall contact area and, thus, promotes cell attachment to vessel walls. Our results demonstrate a link between the formation and function of McTNs, which may provide new insight into metastatic cancer diagnosis and therapy.


Conflict of interest statement

Declaration of interests The authors declare no competing interests.

Figures

Figure 1
Figure 1
Microtentacles in CTCs and RPE-1 cells. (A) Representative images of RPE-1 with MTs stained in. Treatment of detached noncancerous RPE-1 cells with latrunculin A, an inhibitor of actin polymerization, generates McTNs. Scale bars, 10 μm. (B) Schematic representation of possible mechanisms of MT-based protrusion formation at the cell membrane. This process can be driven by MT polymerization dynamics or by sliding of MTs against each other powered by molecular motors. (CF) McTNs have different shapes, numbers, and lengths depending on the cellular system. Scale bars, 10 μm. (C) McTNs in the CTC cell line CTC-MCC-41. Membrane stained with WGA. Image taken from (56). (D) McTNs formed by a CTC of a TNBC patient. Membrane stained with WGA. Image taken from (56). (E) McTNs formed by a cancer HCC1428 cell. α-Tubulin staining. Image taken from (16). (F) McTNs formed by a noncancer RPE-1 cell, α-tubulin staining. (G) McTN length over a time course of 80–120 min of three randomly chosen cells. For each cell and each time point, mean length of all McTNs was determined. Values were normalized by the mean length measured during the first 60 min (error bars show standard deviation.). (H) McTNs improve cell attachment. The relative number of attached cells increases over time of McTN generation. Data collected at 20, 40, 60, and 90 min. Untreated cells (blue bars) are compared with cells treated with 1 μM latrunculin A (red bars) to induce McTN formation. The relative number of attached cells was determined with MTT assay. Attached cells after 5 h 30 min serve as a reference value. ∗∗∗p0.001, ∗∗p0.01, p0.05; n.s., not significant; Mann-Whitney U-test, n 6. Error bars show standard deviation.
Figure 2
Figure 2
MT dynamics within McTNs. (A) Exemplary kymograph of MT plus-end binding protein EB3 within a McTN. Different colors mark examples of different dynamic events, such as anterograde (dark purple lines) and retrograde (light magenta line) polymerization, rescue (blue stars), and catastrophe (yellow stars) events, and new MTs entering the McTN from the cell body (red stars). Scale bars, time, 60 s; space, 5 μm. (B) Frequencies of MTs entering the McTN and rescue events (N= 16). (C) Frequencies of anterograde and retrograde polymerizing EB3 comets (N= 16). (D) Anterograde and retrograde polymerization velocities from EB3 kymographs (N= 35). ∗∗∗p 0.001; n.s., not significant (Mann-Whitney U-test). Horizontal lines of boxplot indicate the median, the boxes represent the interquartile range (IQR, 25th to 75th percentile and whiskers extend to 1.5×IGR. Outliers not shown.)
Figure 3
Figure 3
Fluorescence intensity recovery after photobleaching (FRAP) experiments. (A) Schematic representation of McTN FRAP experiment. A high-intensity laser pulse bleaches the fluorescent MT bundle in a region of interest (ROI). Two possible scenarios for changes in fluorescence intensity of two adjacent regions (ROI1 and ROI2) are depicted. For pure MT polymerization dynamics, the bleached tubulin subunits cannot enter the ROI1 and ROI2 regions; thus, the intensities of these regions remain unchanged. On the contrary, additional forward sliding dynamics of MTs can push bleached tubulin subunits into ROI2 and reduce intensity. (B) Exemplary images of a bleached region (indicated with arrows) over the course of the experiment. Before applying the bleaching pulse on a selected McTN (marked in the left frame), the entire MT bundle is fluorescent. The bleaching pulse results in a local loss and subsequent recovery of fluorescence over time. Scale bars, 10 μm (left panel), 1 μm (rest of the panels). (C) Expected time evolution of fluorescence intensity in ROI, ROI1, and ROI2 regions for two possible scenarios. (D) Expected mean intensity change within a given time interval with respect to the intensity at the bleaching time point for both scenarios and three different regions of interest. (E) Mean intensity change within first 60, 300, or 600 s with respect to the intensity at the bleaching time in ROI1, ROI, and ROI2. All cells were treated with 1 μM latrunculin A. Additionally, 5 μM paclitaxel or 100 μM kinesore was used to inhibit MT polymerization or enhance MT sliding, respectively. Number of experiments: control, N= 23 (blue); paclitaxel, N= 23 (brown); kinesore, N= 24 (green). Error bar shows standard deviation. (F) Schematic representation of the impact of paclitaxel and kinesore on MT dynamics. While paclitaxel inhibits MT polymerization, kinesore enhances the sliding dynamics of MTs. ∗∗∗p 0.001, ∗∗p 0.01, p 0.05; n.s., not significant (t-tests).
Figure 4
Figure 4
MT growth and FRAP simulations. (A) Force exerted on the MT tip (scaled by the asymptotic force F) versus the MT length d scaled by the cell radius r (solid gray line). The dashed line represents the piecewise linear approximation used in our simulations. Insets are schematics of a MT bundle growing against the barrier in different deformation-force regimes. (B) Mean MT length d in terms of the asymptotic force F for a cell of radius 10 μm. (C) Time evolution of the relative intensity in ROI from control experiments (blue line) and simulations with pure polymerization (gray) or polymerization plus forward sliding dynamics of MTs (red). Shaded region indicates standard deviation of experimental data. (D) Mean McTN length obtained from control experiments, simulations with pure MT polymerization, or simulations with polymerization and sliding dynamics. Error bars show standard deviation. (E) Mean intensity change within first 60, 300, or 600 s in ROI1, ROI, and ROI2 obtained from control (blue), reduced polymerization (brown), and enhanced sliding (green) simulations. Error bars show standard deviation.
Figure 5
Figure 5
Detachment of MTs from the MTOC by kinesore treatment. (A) Straightness of McTNs defined as the end-to-end distance divided by the total length of the McTN (left) and mean length of McTNs (right) under different treatments. ∗∗∗p0.001; n.s., not significant; Mann-Whitney U-test, n100. Horizontal lines of boxplot indicate the median, the boxes represent the interquartile range (IQR, 25th to 75th percentile and whiskers extend to 1.5×IGR. Outliers not shown. (B) Moving of a bleached area (marked with arrows) along the McTN due to sliding of MTs in a kinesore-treated cell. The horizontal red line indicates the initial position of the bleached area. Scale bars, 10 μm.
Figure 6
Figure 6
McTN adhesion to vessel walls. (A) Relative wall connection in terms of McTN length and relative stiffness of the McTN, E/ϵ (see text). (B) Example of a kink in a McTN of a kinesore-treated cell indicated by white arrow. Scale bar, 10 μm. (C) Ratio of the wall connection of a homogeneous McTN to that of a McTN with a kink in terms of the relative stiffness E/ϵ and the relative position of the kink with respect to the McTN tip. (D) Relative wall connection compared with the relative stiffness for filaments with homogeneous and inhomogeneous (i.e., with a kink) bending.
Figure 7
Figure 7
Scheme summarizing the mechanism of McTN formation and its function. (A) Polymerization of MTs drives McTN formation. The contribution of MT sliding powered by molecular motors is relatively weak. (B) Schematic representation of CTC within a blood vessel wall. Flexible McTN can enhance the contact with blood vessel walls and thus facilitate adhesion.

Similar articles

  • Short-Term Memory Impairment.
    Cascella M, Al Khalili Y. Cascella M, et al. 2024 Jun 8. In: StatPearls [Internet]. Treasure Island (FL): StatPearls Publishing; 2025 Jan–. 2024 Jun 8. In: StatPearls [Internet]. Treasure Island (FL): StatPearls Publishing; 2025 Jan–. PMID: 31424720 Free Books & Documents.
  • Can a Liquid Biopsy Detect Circulating Tumor DNA With Low-passage Whole-genome Sequencing in Patients With a Sarcoma? A Pilot Evaluation.
    Anderson CJ, Yang H, Parsons J, Ahrens WA, Jagosky MH, Hsu JH, Patt JC, Kneisl JS, Steuerwald NM. Anderson CJ, et al. Clin Orthop Relat Res. 2025 Jan 1;483(1):39-48. doi: 10.1097/CORR.0000000000003161. Epub 2024 Jun 21. Clin Orthop Relat Res. 2025. PMID: 38905450
  • Ventilator Management(Archived).
    Mora Carpio AL, Mora JI. Mora Carpio AL, et al. 2023 Mar 27. In: StatPearls [Internet]. Treasure Island (FL): StatPearls Publishing; 2025 Jan–. 2023 Mar 27. In: StatPearls [Internet]. Treasure Island (FL): StatPearls Publishing; 2025 Jan–. PMID: 28846232 Free Books & Documents.
  • The Black Book of Psychotropic Dosing and Monitoring.
    DeBattista C, Schatzberg AF. DeBattista C, et al. Psychopharmacol Bull. 2024 Jul 8;54(3):8-59. Psychopharmacol Bull. 2024. PMID: 38993656 Free PMC article. Review.
  • Maternal and neonatal outcomes of elective induction of labor.
    Caughey AB, Sundaram V, Kaimal AJ, Cheng YW, Gienger A, Little SE, Lee JF, Wong L, Shaffer BL, Tran SH, Padula A, McDonald KM, Long EF, Owens DK, Bravata DM. Caughey AB, et al. Evid Rep Technol Assess (Full Rep). 2009 Mar;(176):1-257. Evid Rep Technol Assess (Full Rep). 2009. PMID: 19408970 Free PMC article.

References

    1. Alix-Panabières C., Pantel K. Challenges in circulating tumour cell research. Nat. Rev. Cancer. 2014;14:623–631. - PubMed
    1. Pantel K., Speicher M.R. The biology of circulating tumor cells. Oncogene. 2016;35:1216–1224. - PubMed
    1. Hamza B., Ng S.R., et al. Manalis S.R. Optofluidic real-time cell sorter for longitudinal CTC studies in mouse models of cancer. Proc. Natl. Acad. Sci. USA. 2019;116:2232–2236. - PMC - PubMed
    1. Vermesh O., Aalipour A., et al. Gambhir S.S. An intravascular magnetic wire for the high-throughput retrieval of circulating tumour cells in vivo. Nat. Biomed. Eng. 2018;2:696–705. - PMC - PubMed
    1. Ting D.T., Wittner B.S., et al. Haber D.A. Single-cell RNA sequencing identifies extracellular matrix gene expression by pancreatic circulating tumor cells. Cell Rep. 2014;8:1905–1918. - PMC - PubMed

LinkOut - more resources