. 2025 Dec;45(1):1-19.
doi: 10.1080/01652176.2025.2509503. Epub 2025 May 27.

Transcriptomic insights into Mycobacterium orygis infection-associated pulmonary granulomas reveal multicellular immune networks and tuberculosis biomarkers in cattle

Affiliations

Transcriptomic insights into Mycobacterium orygis infection-associated pulmonary granulomas reveal multicellular immune networks and tuberculosis biomarkers in cattle

Rishi Kumar et al. Vet Q. 2025 Dec.

Abstract

Mycobacterium orygis, a member of the Mycobacterium tuberculosis complex (MTBC), has emerged as a significant contributor to tuberculosis (TB) in cattle, wildlife, and humans. However, understanding about its pathogenesis and severity is limited, compounded by the lack of reliable TB biomarkers in cattle. This study delves into the comparative pathology and transcriptomic landscape of pulmonary granulomas in cattle naturally infected with M. orygis, using high-throughput RNA sequencing. Histopathological analysis revealed extensive, multistage granulomatous, necrotic, and cavitary lesions, indicative of severe lung pathology induced by M. orygis. Transcriptomic profiling highlighted numerous differentially expressed genes and dysregulated pathways related to immune response modulation and extracellular matrix remodelling. Additionally, cell type enrichment analysis provided insights into the multicellularity of the granulomatous niche, emphasising complex cell-cell interactions within TB granulomas. Via comparative transcriptomics leveraging publicly available bovine and human TB omics datasets, 14 key immunomodulators (SOD2, IL1α/β, IL15, IL18, CCL2/MCP-1, CCL3/MIP-1α, CCL4/MIP-1β, CCL8/MCP-2, CCL20/MIP-3α, CXCL2/MIP-2, CXCL10/IP-10, CXCL11, and IFN-γ) were identified as potential biomarkers for active TB in cattle. These findings significantly advance our understanding of M. orygis pathogenesis in bovine TB and highlight potential targets for the development of diagnostic tools for managing and controlling the disease.

Keywords: Mycobacterium orygis; RNA sequencing; Tuberculosis; biomarkers; bovine tuberculosis; granuloma; transcriptome; zoonotic TB.


Conflict of interest statement

No potential conflict of interest was reported by the author(s).

Figures

Figure 1.
Figure 1.
Pathological features of lungs of cattle infected with Mycobacterium orygis. Representative gross and histopathological images of (A–D) M. orygis-infected, and (E–H) healthy cattle lungs. Photographs of (A, E) cow lung tissues, (B, F) formalin-fixed tissue sections, (C, D & G, H) H&E-stained histopathological tissue sections from infected and healthy cattle, respectively. Gross and microscopy examination revealed typical granulomatous tissue morphology with the presence of caseous, necrotic, and cavitary lesions in the lungs of M. orygis-infected cattle compared to healthy cattle depicting intact lung parenchyma and alveolar structures. The bar depicts 2000 μm (C,G) and 500 μm (D,H).
Figure 2.
Figure 2.
Comparative transcriptome analysis of Mycobacterium orygis infected and healthy cattle lungs. (A) PCA plot generated using DESeq2 data, showing variation within and between healthy and diseased groups. (B) Hierarchical clustering based on Euclidean distance using regularised log-transformed count data. (C) Heatmap of the top 50 differentially expressed genes, with colours indicating gene abundance from dark red (high) to light blue. (D) Volcano plot showing upregulated (red) and downregulated (blue) DEGs in M. orygis-infected versus healthy lung tissue, with FDR < 0.05 and Log2FC > 2. N = 3 per group, CBL_I: crossbred lung infected; CBL_N: crossbred lung normal; PC: principal component.
Figure 3.
Figure 3.
Alteration of the cellular composition of lungs following Mycobacterium orygis infection. Global cell type enrichment analysis was performed using xCell on normalised read counts. Pie charts display the proportions of various cell types in (A) healthy (n = 3), and (B) M. orygis-infected cattle lung tissues (n = 3). Colours in the pie charts are assigned randomly, representing cell proportions from highest to lowest. (C) Comparative analysis of cell type proportions between infected and healthy lungs.
Figure 4.
Figure 4.
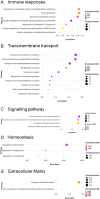
Pathway enrichment analysis of the up-regulated DEGs in M. orygis infected granulomatous lungs. Upregulated DEGs are enriched in the following biological pathways: (A) immune response, (B) transmembrane transport, (C) signalling pathway, (D) homeostasis, and (E) extracellular matrix. Analysis was performed using ShinyGO, and figures were prepared using R-Studio.
Figure 5.
Figure 5.
Pathway enrichment analysis of the down-regulated DEGs in M. orygis infected granulomatous lungs. Down-regulated DEGs are enriched in the following biological pathways: (A) Immune system, (B) cell death, and (C) lipid metabolism. Analysis was performed using ShinyGO, and figures were prepared using R-Studio.
Figure 6.
Figure 6.
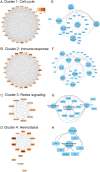
Critical gene network analysis of the up-regulated DEGs in the M. orygis infected cattle lungs: (A–D) Four key gene network clusters identified by MCODE in Cytoscape: (A) cluster 1: cell cycle, (B) cluster 2: immune response, (C) cluster 3: redox signalling, and (D) cluster 4: haemostasis. (E–H) Corresponding pathways for each gene network cluster were identified using the ClueGO plugin in Cytoscape.
Figure 7.
Figure 7.
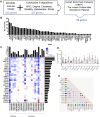
Potential biomarkers of active TB in cattle. (A) Identification of 122 genes via MCODE and CytoHubba analysis. (B) Detection frequency of 55 serum/plasma proteins across transcriptome studies. (C) Heatmap of Log2FC values for key genes detected in over five studies, with associated bar graphs showing the number of studies with gene upregulation and the number of genes detected per study. In the heatmap, shades of blue colour indicate upregulation, and red indicate downregulation. (D) Dot plot with mean ± SD representing Log2FC values for selected genes across 21 transcriptome studies. The black triangles indicate human studies, and the red dots indicate bovine studies. (E) Co-expression analysis of 14 shortlisted genes using STRING software.
Figure 8.
Figure 8.
Relative mRNA expression of shortlisted genes by qRT-PCR. Real-time RT-PCR was conducted on 14 genes (SOD2, IL1α/β, IL15, IL18, CCL2/MCP-1, CCL3/MIP-1α, CCL4/MIP-1β, CCL8/MCP-2, CCL20/MIP-3α, CXCL2/MIP-2, CXCL10/IP-10, CXCL11, and IFN-γ). fold expression was calculated using the 2−ΔΔCT method. Bars represent the average fold change values ± SD (n = 3) from qRT-PCR and RNA-seq analysis, comparing M. orygis-infected cattle lung tissues to healthy lungs. The dots in the qRT-PCR data represent individual samples.

References

    1. Alsayed SSR, Gunosewoyo H.. 2023. Tuberculosis: pathogenesis, current treatment regimens and new drug targets. Int J Mol Sci. 24(6):5202. doi: 10.3390/ijms24065202. - DOI - PMC - PubMed
    1. Aran D, Hu Z, Butte AJ.. 2017. xCell: digitally portraying the tissue cellular heterogeneity landscape. Genome Biol. 18(1):220. doi: 10.1186/s13059-017-1349-1. - DOI - PMC - PubMed
    1. Bader GD, Hogue CW.. 2003. An automated method for finding molecular complexes in large protein interaction networks. BMC Bioinf. 4(1):2. doi: 10.1186/1471-2105-4-2. - DOI - PMC - PubMed
    1. Basnyat B, Caws M, Udwadia Z.. 2018. Tuberculosis in South Asia: a tide in the affairs of men. Multidiscip Respir Med. 13(1):10. doi: 10.1186/s40248-018-0122-y. - DOI - PMC - PubMed
    1. Benmerzoug S, Marinho FV, Rose S, Mackowiak C, Gosset D, Sedda D, Poisson E, Uyttenhove C, Van Snick J, Jacobs M, et al. . 2018. GM-CSF targeted immunomodulation affects host response to M. tuberculosis infection. Sci Rep. 8(1):8652. doi: 10.1038/s41598-018-26984-3. - DOI - PMC - PubMed