. 2025 Jun 15;39(11):e70681.
doi: 10.1096/fj.202500964R.

Long Noncoding RNA NONHSAT233728.1 Promotes ROS Accumulation and Granulosa Cell Apoptosis by Regulating the MAPK/ERK1/2 Signaling Pathway

Affiliations

Long Noncoding RNA NONHSAT233728.1 Promotes ROS Accumulation and Granulosa Cell Apoptosis by Regulating the MAPK/ERK1/2 Signaling Pathway

Yao Chen et al. FASEB J. .

Abstract

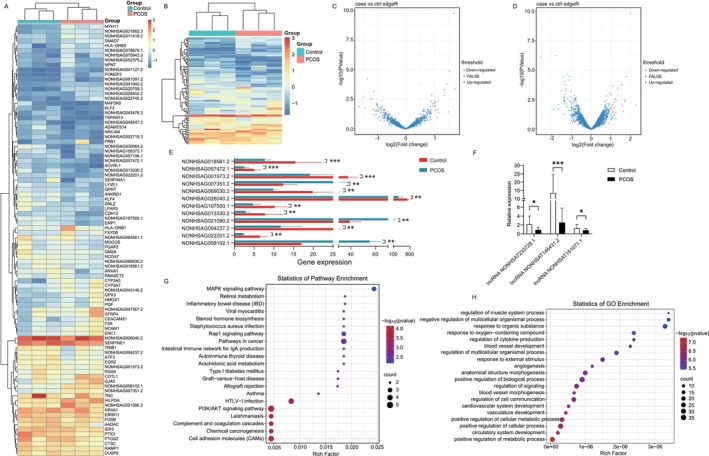
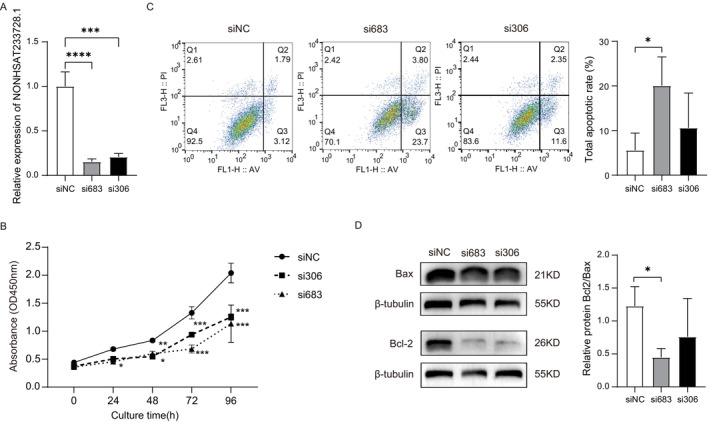
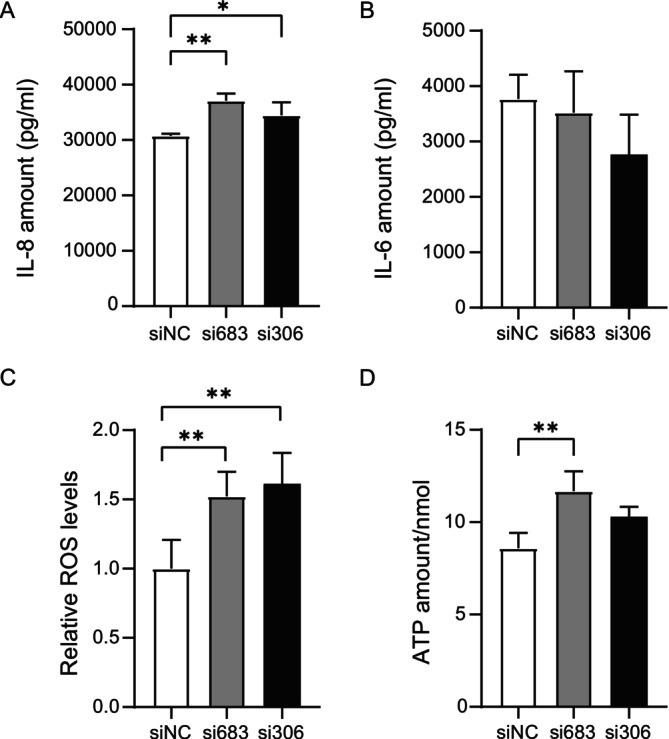
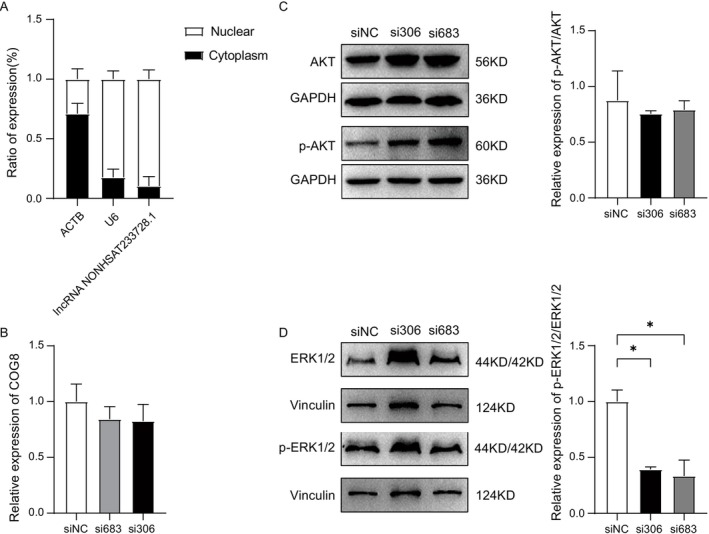
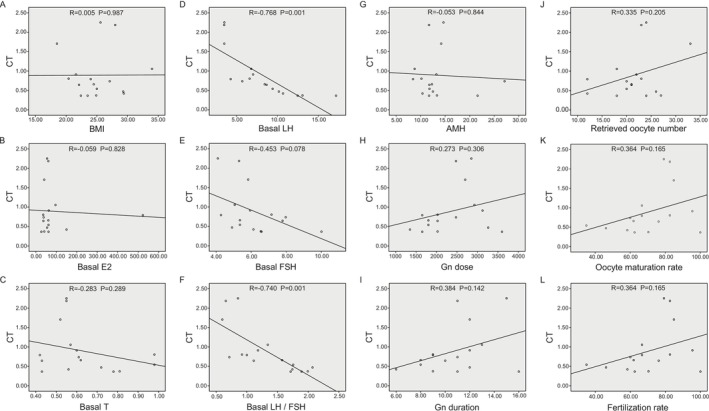
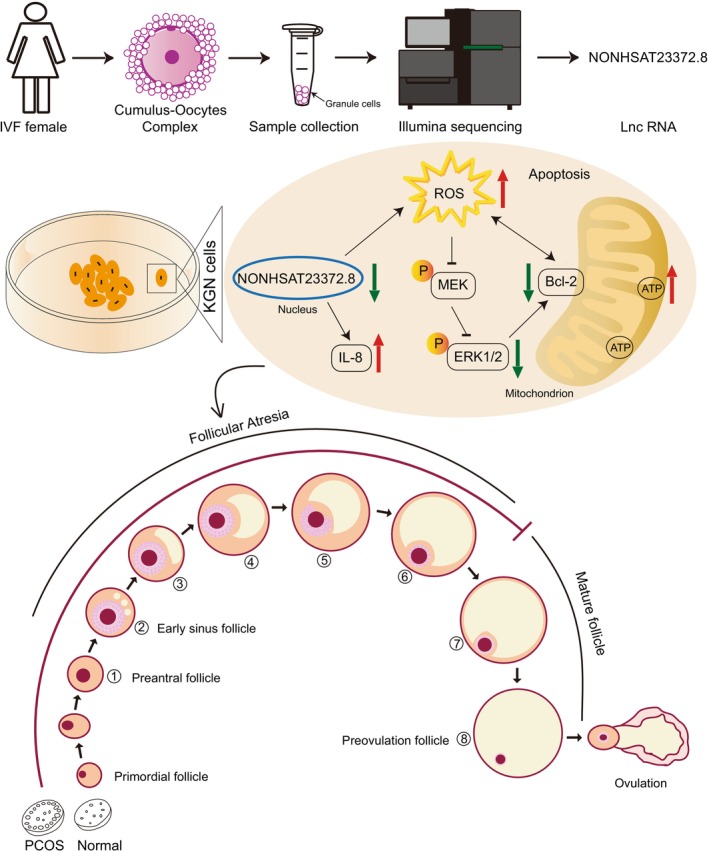
Polycystic ovary syndrome (PCOS) is one of the most prevalent endocrine disorders in women of reproductive age. However, the underlying molecular mechanism remains unclear. In this study, we employed RNA sequencing analysis to identify differentially expressed protein-coding genes and long noncoding RNA (lncRNA) expression profiles in granulosa cells from women with and without PCOS. It was established that the level of NONHSAT233728.1 was diminished in women with PCOS. The present study demonstrated the role of NONHSAT233728.1 in granulosa cells from patients with PCOS and further investigated the potential mechanism of NONHSAT233728.1 in the KGN cell line. Additionally, the knockdown of NONHSAT233728.1 has been observed to promote cell apoptosis, inhibit cell proliferation, promote mitochondrial dysfunction, and inflammation. Western blot analyses confirmed that phospho-extracellular regulated protein kinases (ERK)1/2 were decreased following lnc-NONHSAT233728.1 knockdown. Consequently, we propose that ROS accumulation activates the endogenous mitochondrial apoptosis pathway, leading to granulosa cell apoptosis via the MEK/ERK1/2 pathway, which contributes to follicular atresia. We observed a negative correlation between NONHSAT233728.1 and both LH levels and the LH/FSH ratio. These findings indicate that lncRNA NONHSAT233728.1 is linked to the pathogenesis of PCOS and offer new insights into its underlying mechanisms.

Keywords: apoptosis; granulosa cell; lncRNA; polycystic ovary syndrome; reactive oxygen species.


Conflict of interest statement

The authors declare no conflicts of interest.

Figures

FIGURE 1
FIGURE 1
Differentially expressed lncRNAs and differentially expressed genes (DEGs) in granulosa cells from women with and without PCOS. (A, B) Heat map of the differentially expressed lncRNAs (fold change ≥ 2 and p value ≤ 0.05). (C) Volcano plot of differentially expressed lncRNAs. Among these lncRNAs, 16 lncRNAs were upregulated and 16 lncRNAs were downregulated. (D) Volcano plot of differentially expressed mRNAs. Among these mRNAs, 21 were upregulated and 37 were downregulated. (E) Twelve differentially expressed genes in RNA‐seq. The horizontal axis represents gene expression levels, while the vertical axis denotes the names of the lncRNAs. The data are presented with the control group indicated in red and the PCOS group in blue, *p < 0.05, **p < 0.05, ***p < 0.001. (F) The expression levels of three differentially expressed lncRNAs in a cohort of 20 PCOS patients and 20 controls using RT‐qPCR, *p < 0.05, **p < 0.05, ***p < 0.001. (G) KEGG pathway analysis on the mRNA expression data. (H) Gene Ontology (GO) functional analysis on biological processes. Data are expressed as the mean ± SD (n = 3).
FIGURE 2
FIGURE 2
Knockdown of lnc‐NONHSAT233728.1 regulates proliferation and apoptosis of KGN cells. (A) Graph showing the expression level of lnc‐NONHSAT233728.1 in KGN cells treated with three different siRNA sequences via RT‐qPCR. The three distinct RNA sequences are siNC, si306, and si683, ****p < 0.0001. (B) Cell viability of KGN cells after transfection was measured by using Cell Counting Kit‐8, *p < 0.05, **p < 0.05, ***p < 0.001. (C) The apoptosis of transfected KGN cells was detected using Annexin V/PI staining, *p < 0.05. (D) The protein levels of Bax and Bcl‐2 in transfected KGN cells. Data are expressed as the mean ± SD (n = 3).
FIGURE 3
FIGURE 3
Knockdown of lnc‐NONHSAT233728.1 regulates pro‐inflammatory factor and impairs mitochondrial function in vitro. (A) Knockdown of lnc‐NONHSAT233728.1 upregulates the levels of IL‐8 in KGN cells, *p < 0.05, **p < 0.05. (B) Knockdown of lnc‐NONHSAT233728.1 upregulates the levels of IL‐6 in KGN cells, although no significant differences were observed between the samples. The expression of IL‐6 and IL‐8 was detected using an iMatrix 100 luminometer. (C) Knockdown of lnc‐NONHSAT233728.1regulates cell reactive oxygen species (ROS) generation in KGN cells, **p < 0.01. (D) The level of intracellular ATP was detected in transfected KGN cells, **p < 0.01. Data are expressed as the mean ± SD (n = 3).
FIGURE 4
FIGURE 4
Subcellular localization and intrinsic mechanisms of lnc‐NONHSAT233728.1. (A) Nuclear and cytoplasmic fractions were analyzed using RT‐qPCR to determine the intracellular localization of NONHSAT233728.1. ACTB was used as a control for the cytoplasmic fraction, while U6 served as a control for the nuclear fraction. (B) The targeted mRNA expression of lncRNA NONHSAT233728.1. (C) The activity of PI3K/AKT signaling pathway was assessed by Western blot analysis following siRNA treatment. Protein levels of p‐AKT and AKT were evaluated using this method. (D) The activity of the MAPK/ERK1/2 signaling pathway was analyzed by Western blot after siRNA treatment. The protein levels of p‐ERK1/2 and ERK1/2 were detected by Western blot, *p < 0.05. Data are expressed as the mean ± SD (n = 3).
FIGURE 5
FIGURE 5
Correlations between NONHSAT233728.1 expression and clinical parameters. (A) Graph showing correlation between the relative expression of lnc‐NONHSAT233728.1 in granulosa cells of PCOS patients and BMI. (B) Graph showing correlation between the relative expression of lnc‐NONHSAT233728.1 in granulosa cells of PCOS patients and basal E2 levels. (C) Graph showing correlation between the relative expression of lnc‐NONHSAT233728.1 in granulosa cells of PCOS patients and Basal T levels. (D) Graph showing correlation between the relative expression of lnc‐NONHSAT233728.1 in granulosa cells of PCOS patients and Basal LH levels. (E) Graph showing correlation between the relative expression of lnc‐NONHSAT233728.1 in granulosa cells of PCOS patients and Basal FSH levels. (F) Graph showing correlation between the relative expression of lnc‐NONHSAT233728.1 in granulosa cells of PCOS patients and LH/FSH ratio. (G) Graph showing correlation between the relative expression of lnc‐NONHSAT233728.1 in granulosa cells of PCOS patients and AMH. (H) Graph showing correlation between the relative expression of lnc‐NONHSAT233728.1 in granulosa cells of PCOS patients with Gn dose. (I) Graph showing correlation between the relative expression of lnc‐NONHSAT233728.1 in granulosa cells of PCOS patients and Gn duration. (J) Graph showing correlation between the relative expression of lnc‐NONHSAT233728.1 in granulosa cells of PCOS patients and number of oocytes retrieved. (K) Graph showing correlation between the relative expression of lnc‐NONHSAT233728.1 in granulosa cells of PCOS patients and oocyte maturation rate. (L) Graph showing correlation between the relative expression of lnc‐NONHSAT233728.1 in granulosa cells of PCOS patients and fertilization rate. AMH, anti‐mullerian hormone; BMI, body mass index; E2, estradiol; FSH, follicle‐stimulating hormone; LH, luteinizing hormone; T, testosterone; oocyte maturation rate, number of oocytes at MII (metaphase II oocytes, 1st polar body) stage/total number of oocytes retrieved; Fertilization rate, number of fertilized embryos/total number of oocytes retrieved.
FIGURE 6
FIGURE 6
Schematic diagram for lnc‐NONHSAT233728.1function in women with PCOS. We employed RNA sequencing analysis to identify differentially expressed protein‐coding genes and long noncoding RNA (lncRNA) expression profiles in granulosa cells from women with and without PCOS. It was established that the level of NONHSAT233728.1 was diminished in women with PCOS. The present study demonstrated the role of NONHSAT233728.1 in granulosa cells from patients with PCOS and further investigated the potential mechanism of NONHSAT233728.1 in the KGN cell line. Knockdown of lnc‐NONHSAT233728.1 expression resulted in mitochondrial dysfunction and inflammation, characterized by the accumulation of reactive oxygen species (ROS). We hypothesize that this accumulation activates the endogenous mitochondrial apoptosis pathway, resulting in granulosa cell apoptosis through the MEK/ERK1/2 signaling pathway, which contributes to follicular atresia.

Similar articles

References

    1. Escobar‐Morreale H. F., “Polycystic Ovary Syndrome: Definition, Aetiology, Diagnosis and Treatment,” Nature Reviews Endocrinology 14 (2018): 270–284, 10.1038/nrendo.2018.24. - DOI - PubMed
    1. Mu L., Ye Z., Hu J., et al., “PPM1K‐Regulated Impaired Catabolism of Branched‐Chain Amino Acids Orchestrates Polycystic Ovary Syndrome,” eBioMedicine 89 (2023): 104492, 10.1016/j.ebiom.2023.104492. - DOI - PMC - PubMed
    1. Joham A. E., Norman R. J., Stener‐Victorin E., et al., “Polycystic Ovary Syndrome,” Lancet Diabetes & Endocrinology 10 (2022): 668–680, 10.1016/s2213-8587(22)00163-2. - DOI - PubMed
    1. Patel S., “Polycystic Ovary Syndrome (PCOS), an Inflammatory, Systemic, Lifestyle Endocrinopathy,” Journal of Steroid Biochemistry and Molecular Biology 182 (2018): 27–36, 10.1016/j.jsbmb.2018.04.008. - DOI - PubMed
    1. Choudhury A. A. and Rajeswari V. D., “Polycystic Ovary Syndrome (PCOS) Increases the Risk of Subsequent Gestational Diabetes Mellitus (GDM): A Novel Therapeutic Perspective,” Life Sciences 310 (2022): 121069, 10.1016/j.lfs.2022.121069. - DOI - PubMed

Substances

LinkOut - more resources