. 2025 Dec;17(1):2512211.
doi: 10.1080/19420862.2025.2512211. Epub 2025 May 28.

Assessment of biophysical properties of the first-in-class anti-cancer IgE antibody drug MOv18 IgE demonstrates monomeric purity and stability

Affiliations

Assessment of biophysical properties of the first-in-class anti-cancer IgE antibody drug MOv18 IgE demonstrates monomeric purity and stability

Paul Considine et al. MAbs. 2025 Dec.

Abstract

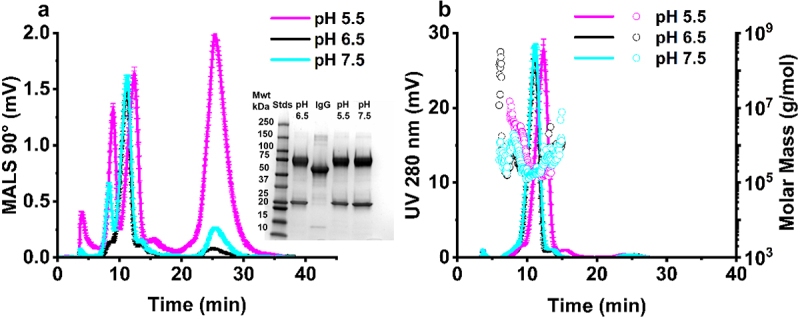
Therapeutic monoclonal antibodies, which are almost exclusively IgG isotypes, show significant promise but are prone to poor solution stability, including aggregation and elevated solution viscosity at dose-relevant concentrations. Recombinant IgE antibodies are emerging cancer immunotherapies. The first-in-class MOv18 IgE, recognizing the cancer-associated antigen folate receptor-alpha (FRα), completed a Phase 1 clinical trial in patients with solid tumors, showing early signs of efficacy at a low dose. The inaugural process development and scaled manufacture of MOv18 IgE for clinical testing were undertaken with little baseline knowledge about the solution phase behavior of recombinant IgE at dose-relevant concentrations. We evaluated MOv18 IgE physical stability in response to environmental and formulation stresses encountered throughout shelf life. We analyzed changes in physical stability using multiple orthogonal analytical techniques, including particle tracking analysis, size exclusion chromatography, and multidetector flow field flow fractionation hyphenated with UV. We used dynamic and multiangle light scattering to profile aggregation status. Formulation at pH 6.5, selected for use in the Phase 1 trial, resulted in high monomeric purity and no submicron proteinaceous particulates. Formulation at pH 5.5 and 7.5 induced significant submicron and sub-visible particle formation. IgE formulation was resistant to aggregation in response to freeze-thaw stress, retaining high monomeric purity. Exposure to thermal stress at elevated temperatures resulted in loss of monomeric purity and aggregation. Agitation stress-induced submicron and subvisible aggregation, but monomeric purity was not significantly affected. MOv18 IgE retains monomeric purity in response to formulation and stress conditions, confirming stability. Our results offer crucial guidance for future IgE-based drug development.

Keywords: Cancer immunotherapy; IgE; formulation; immunoglobulin; monoclonal antibody; particle size; protein aggregation; stability.


Conflict of interest statement

J.S. and S.N.K. are founders and shareholders of Epsilogen Ltd. H.J.B. is employed through a fund provided by Epsilogen Ltd. J.C. has been employed through a fund provided by Epsilogen Ltd. All other authors declare no conflict of interest.

Figures

Schematic showing the methods used to induce stress in MOv 18 IgE samples. Top panel shows the application of two thermal stress protocols, freeze–thaw stress and agitation stress. Bottom panel shows the storage of MOv18 at pH 5.5–7.5.
Figure 1.
Sample preparation for mimicking stressed conditions.
Flow field flow fractionation multiangle light scattering traces for IgE samples incubated at different pH, with corresponding UV trace and molar mass distribution represented for the same samples on the right. SDS-PAGE profile of the samples at different pH.
Figure 2.
Characterization of pH effects on IgE monomeric purity. Corresponding AF4-MALS 90° fractogram (a), AF4-UV fractogram trace (y-axis left) measured at 280 nm, and corresponding AF4-MALS molar mass distribution (g/mol) (y-axis right) (b), SDS-PAGE analysis of molecular weight (a) inset. All samples were formulated at 1 mg/mL. Error bars represent ± standard deviation (N = 3) (2–8 °C). mwt – molecular weight, STDs – weight standards, BL – baseline, IgG – IgG standard.
Particle size distribution data for IgE under different pH conditions as measured by nanoparticle tracking analysis (top panel) and dynamic light scattering (bottom panel).
Figure 3.
Formulation of IgE at different formulation buffer pH leads to the formation of submicron particles. (a) Analysis of size distribution by nanoparticle tracking analysis (NTA) (b) particle size span determined by NTA, (c) analysis of size distribution by dynamic light scattering (DLS) intensity-based size distribution, and (d) Z-average and polydispersity index (PDI) determined by DLS. All IgE samples were analyzed at 1 mg/mL in pH 5.5, 6.5 and 7.5 buffer (2–8 °C). Error bars represent mean ± standard deviation (N = 3), statistical analysis was completed using a tukey test *p < 0.05, **p < 0.01, ***p = 0.001, ****p < 0.001, ns – not significant versus pH 6.5 unless indicated.
Homology model of IgE whole structure, Fab and Fv region, and in silico predicted parameters of isoelectric point (left). Corresponding measured zeta potential at different pH (right).
Figure 4.
In silico prediction and experimental confirmation of IgE isoelectric point (pI). Homology modelling predicts charge parameters for IgE structure and sequence and structure-based isoelectric point. (a) Homology model to predict pI, conducted from the structure of anti-high molecular weight melanoma associated antigen IgE. For all structures, the CDRL 1, 2 and 3 (purple), CDRH 1, 2 and 3 (red), variable light chain region (light green), variable heavy chain region (dark green), light chain constant (light blue), heavy chain constant (dark blue) and Fc (grey) were annotated with IMGT numbering. The full IgE model (a), Fab region (b), and Fv region (c) models are shown with their respective sequence-based (pI_seq) and structure-based (pI_3D) isoelectric points as well as the zeta potential at pH 6, 0.1 M ionic strength (d). (b) Zeta potential measurements for all IgE samples were performed at 1mg/mL in pH 5, pH 5.5, 6.5 and 7.5 buffer (2–8 °C), to confirm that decreasing pH leads to IgE surface neutrality. Error bars represent ± standard deviation (n=3).
Flow field flow fractionation MALS and UV traces showing the impact of thermal and freeze thaw stress on IgE stability.
Figure 5.
The effect of thermal stress and freeze-thaw protocols on IgE physical stability. AF4-MALS 90° fractogram trace (a) and AF4-UV at 280 nm fractogram trace (y-axis left) and corresponding AF4-MALS molar mass distribution (g/mol) (y-axis right) (b) for samples untreated (baseline) and exposed to 56 °C for 24 hours and 80 °C for 15 min. Corresponding AF4-MALS trace in response to freeze-thaw (5×) (c) and AF4-UV trace (y-axis left) and AF4-MALS molar mass distribution (g/mol) (y-axis right) (d), SDS-PAGE analysis of molecular weight (c, inset). All samples were formulated at 1 mg/mL and pH 6.5. Error bars represent mean ± standard deviation (N = 3). mwt – molecular weight, STDs – weight standards, BL – baseline, IgG – IgG standard.
Nanoparticle tracking analysis and dynamic light scattering data showing the impact of thermal and freeze thaw stress on IgE particle size distribution.
Figure 6.
The effect of thermal and freeze-thaw stress on IgE aggregation status. Analysis of IgE size distribution by (a) nanoparticle tracking analysis (NTA), (b) NTA span, (c) dynamic light scattering (DLS) intensity-based size distribution used to calculate, and (d) Z-average and polydispersity index (PDI) determined from DLS. Mean ± standard deviation (N = 3). Statistical analysis was performed using a Tukey simultaneous test for difference of means - ****p < 0.001, ns – not significant versus baseline.
Flow field flow fractionation MALS and UV traces showing the impact of agitation stress on IgE physical stability.
Figure 7.
AF4-UV-MALS analysis of IgE following agitation stress. Agitation minimally changed elution time (a-b), molar mass (g/mol) (b), and molecular weight (a inset). IgE (1 mg/mL) from baseline untreated (pH 6.5) and after 48 hours shaking agitation stress at 250 rpm (2–8 °C), mean ± standard deviation (N = 3). mwt – molecular weight, STDs – weight standards, BL – baseline, IgG – IgG standard.
Nanoparticle tracking analysis and dynamic light scattering particle size distributions showing the impact of agitation stress on IgE particle size distribution.
Figure 8.
Agitation stress induces the formation of submicron size aggregates. Analysis of IgE size distribution by (a) nanoparticle tracking analysis (NTA) and (c) dynamic light scattering (DLS) used to calculate, (b) NTA span, and (d) Z-average and polydispersity index (PDI). IgE (1 mg/mL) from baseline untreated and 48 hours agitation stress at 250 rpm (2–8 °C). Mean ± S.D. (N = 3), statistical analysis was completed using a Tukey simultaneous test for difference of means - **p < 0.01, ns – not significant versus baseline.

Similar articles

References

    1. Chauhan J, McCraw A, Nakamura M, Osborn G, Sow H, Cox V, Stavraka C, Josephs D, Spicer J, Karagiannis S, et al. IgE antibodies against cancer: efficacy and safety. Antibodies. 2020;9(4):1–16. doi: 10.3390/antib9040055. - DOI - PMC - PubMed
    1. Sutton B, Davies A, Bax H, Karagiannis S.. IgE antibodies: from structure to function and clinical translation. Antibodies. 2019;8(1):19. doi: 10.3390/antib8010019. - DOI - PMC - PubMed
    1. McCraw AJ, Chauhan J, Bax HJ, Stavraka C, Osborn G, Grandits M, López-Abente J, Josephs DH, Spicer J, Wagner GK, et al. Insights from IgE immune surveillance in Allergy and cancer for anti-tumour IgE treatments. Cancers. 2021;13(17):4460. doi: 10.3390/cancers13174460. - DOI - PMC - PubMed
    1. Markov SD, Caffrey TC, O’Connell KA, Grunkemeyer JA, Shin S, Hanson R, Patil PP, Shukla SK, Gonzalez D, Crawford AJ, et al. IgE-based therapeutic combination enhances antitumor response in preclinical models of pancreatic cancer. Mol Cancer Ther. 2021;20(12):2457–2468. doi: 10.1158/1535-7163.MCT-21-0368. - DOI - PMC - PubMed
    1. Crescioli S, White AL, Karagiannis SN.. Special issue “antibody engineering for cancer immunotherapy. Antibodies. 2022;11(29):1–3. doi: 10.3390/antib11020029. - DOI - PMC - PubMed

MeSH terms

LinkOut - more resources