

Adaptive human behavior and delays in information availability autonomously modulate epidemic waves
- PMID: 40432904
- PMCID: PMC12107549
- DOI: 10.1093/pnasnexus/pgaf145
Adaptive human behavior and delays in information availability autonomously modulate epidemic waves
Abstract
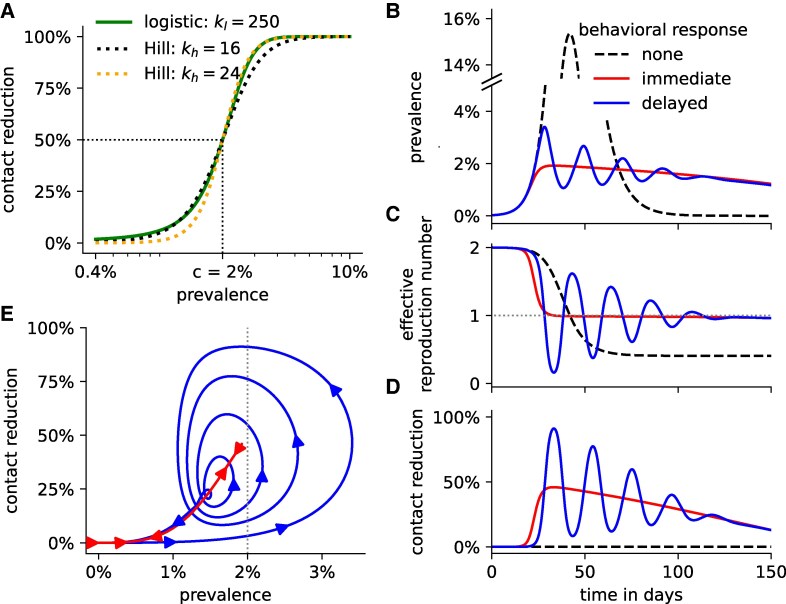
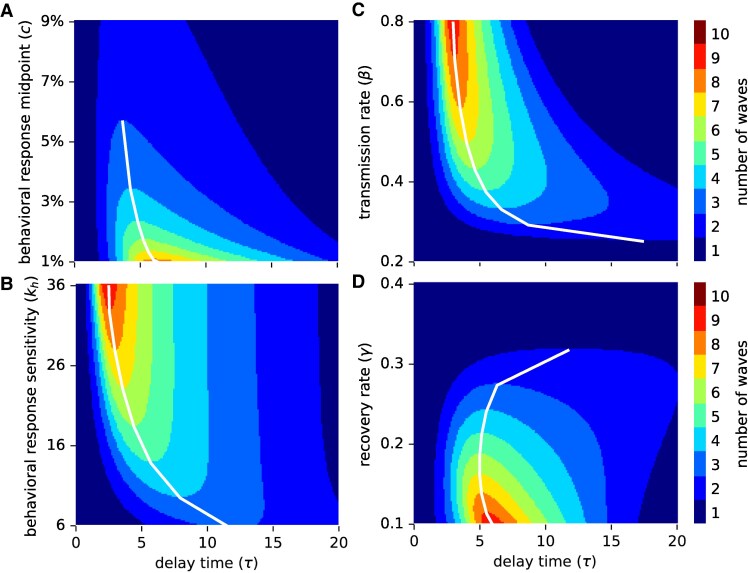
The recurrence of epidemic waves has been a hallmark of infectious disease outbreaks. Repeated surges in infections pose significant challenges to public health systems, yet the mechanisms that drive these waves remain insufficiently understood. Most prior models attribute epidemic waves to exogenous factors, such as transmission seasonality, viral mutations, or implementation of public health interventions. We show that epidemic waves can emerge autonomously from the feedback loop between infection dynamics and human behavior. Our results are based on a behavioral framework in which individuals continuously adjust their level of risk mitigation subject to their perceived risk of infection, which depends on information availability and disease severity. We show that delayed behavioral responses alone can lead to the emergence of multiple epidemic waves. The magnitude and frequency of these waves depend on the interplay between behavioral factors (delay, severity, and sensitivity of responses) and disease factors (transmission and recovery rates). Notably, if the response is either too prompt or excessively delayed, multiple waves cannot emerge. Our results further align with previous observations that adaptive human behavior can produce nonmonotonic final epidemic sizes, shaped by the trade-offs between various biological and behavioral factors-namely, risk sensitivity, response stringency, and disease generation time. Interestingly, we found that the minimal final epidemic size occurs on regimes that exhibit a few damped oscillations. Altogether, our results emphasize the importance of integrating social and operational factors into infectious disease models, in order to capture the joint evolution of adaptive behavioral responses and epidemic dynamics.
Keywords: adaptive human behavior; behavioral epidemiology; infectious disease modeling; nonlinear dynamics; risk perception.
© The Author(s) 2025. Published by Oxford University Press on behalf of National Academy of Sciences.
Figures


Similar articles
-
Heterogeneous risk tolerance, in-groups, and epidemic waves.Front Appl Math Stat. 2024;10:1360001. doi: 10.3389/fams.2024.1360001. Epub 2024 Apr 5. Front Appl Math Stat. 2024. PMID: 38818516 Free PMC article.
-
Multiple epidemic waves as the outcome of stochastic SIR epidemics with behavioral responses: a hybrid modeling approach.Nonlinear Dyn. 2023;111(1):887-926. doi: 10.1007/s11071-022-07317-6. Epub 2022 Mar 15. Nonlinear Dyn. 2023. PMID: 35310020 Free PMC article.
-
The impacts of simultaneous disease intervention decisions on epidemic outcomes.J Theor Biol. 2016 Apr 21;395:1-10. doi: 10.1016/j.jtbi.2016.01.027. Epub 2016 Jan 29. J Theor Biol. 2016. PMID: 26829313 Free PMC article.
-
Tuberculosis.In: Holmes KK, Bertozzi S, Bloom BR, Jha P, editors. Major Infectious Diseases. 3rd edition. Washington (DC): The International Bank for Reconstruction and Development / The World Bank; 2017 Nov 3. Chapter 11. In: Holmes KK, Bertozzi S, Bloom BR, Jha P, editors. Major Infectious Diseases. 3rd edition. Washington (DC): The International Bank for Reconstruction and Development / The World Bank; 2017 Nov 3. Chapter 11. PMID: 30212088 Free Books & Documents. Review.
-
Folic acid supplementation and malaria susceptibility and severity among people taking antifolate antimalarial drugs in endemic areas.Cochrane Database Syst Rev. 2022 Feb 1;2(2022):CD014217. doi: 10.1002/14651858.CD014217. Cochrane Database Syst Rev. 2022. PMID: 36321557 Free PMC article.
References
-
- Miller MA, Viboud C, Balinska M, Simonsen L. 2009. The signature features of influenza pandemics—implications for policy. N Engl J Med. 360(25):2595–2598. - PubMed
-
- Ogilvy Kermack W, McKendrick AG. 1927. A contribution to the mathematical theory of epidemics. Proc R Soc Lond Ser A Contain Pap Math Phys Character. 115(772):700–721.
-
- Hethcote HW. 2000. The mathematics of infectious diseases. SIAM Rev. 42(4):599–653.
LinkOut - more resources
Full Text Sources
