

The Association of Body Mass Index and Adiposity-Estimating Equations with Measures of Obstructive Sleep Apnea Severity: A Cross-Sectional Study
- PMID: 40432910
- PMCID: PMC12106913
- DOI: 10.2147/NSS.S504426
The Association of Body Mass Index and Adiposity-Estimating Equations with Measures of Obstructive Sleep Apnea Severity: A Cross-Sectional Study
Abstract
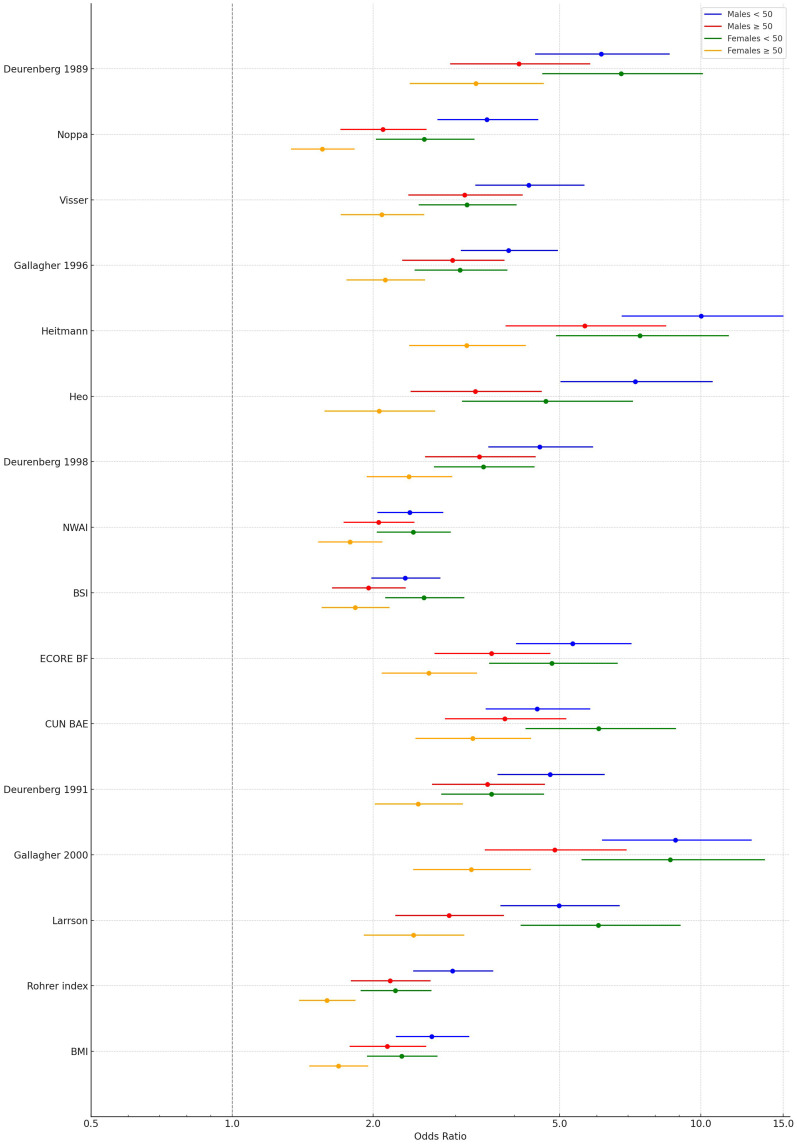
Background and purpose: Obesity, a risk factor for obstructive sleep apnea (OSA), is usually estimated by body mass index (BMI). However, other adiposity-estimating equations may better capture variations in fat distribution. This study assessed the relationship between OSA severity and 15 adiposity-estimating equations, compared to BMI, with subgroup analyses by sex and age (<50 vs ≥50).
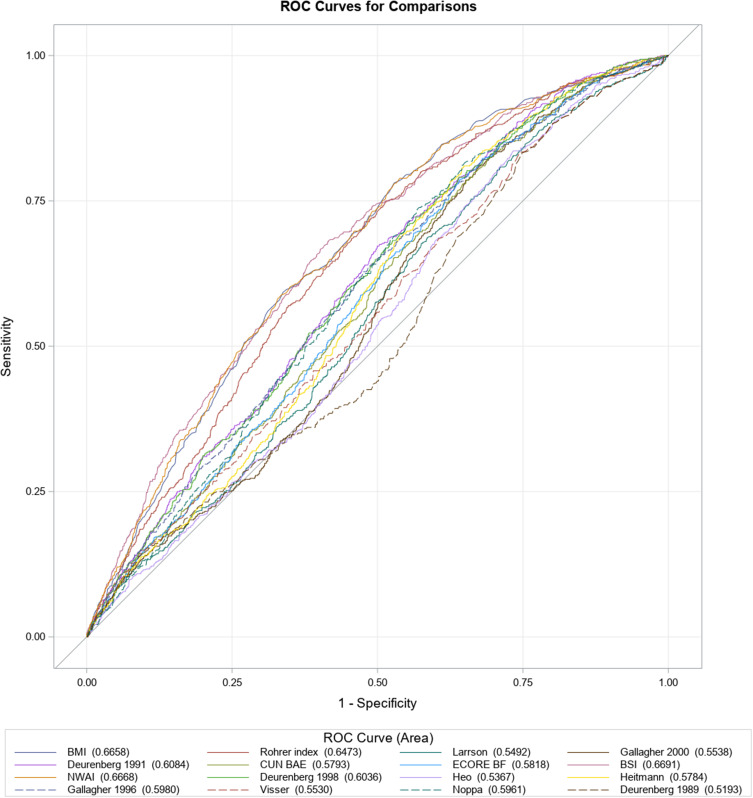
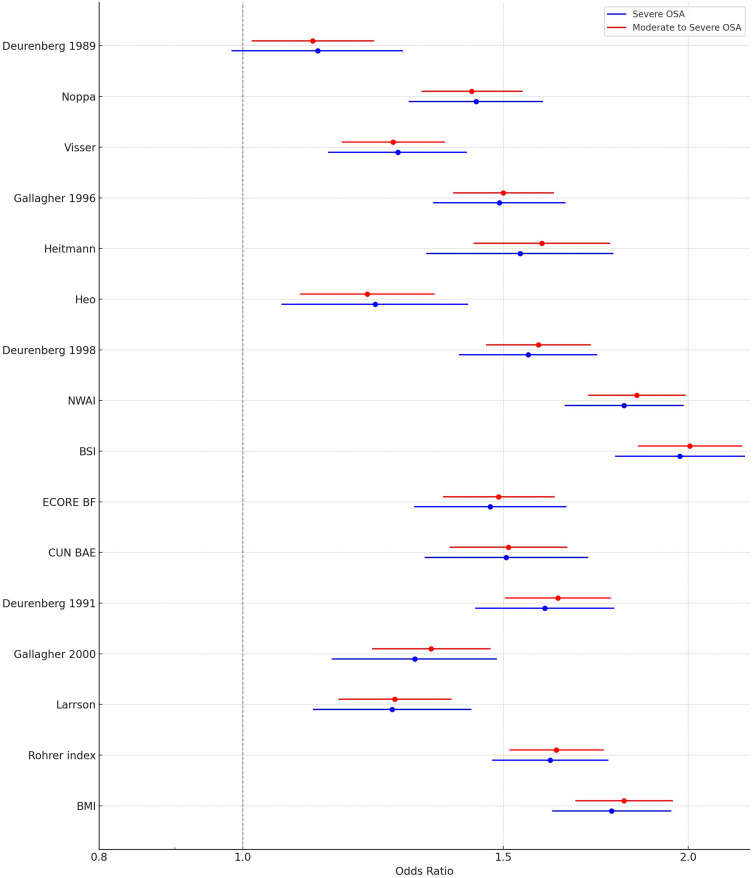
Patients and methods: We conducted a cross-sectional cohort study using data from 5021 consecutive adults who underwent a Level 1 polysomnography (2015-2017) in a large academic sleep center in Ottawa, Canada. We assessed correlations between adiposity measures and the apnea-hypopnea index (AHI) and examined discriminative ability for moderate-to-severe (AHI ≥15/h) and severe OSA (AHI >30/h) using univariate logistic regressions.
Results: The mean age was 49.5 years, 46.6% were women; the mean BMI was 30.0 kg/m2 and 12.7% had severe OSA. All adiposity equations showed negligible (Pearson r 0.0 to ±0.3) to low (Pearson r ± 0.30 to 0.50) statistically significant correlations with AHI, with many of the equations having a marginally stronger correlation coefficient than BMI, in total and subgroup analysis. Discriminative ability for severe OSA was generally low, with c-indices ranging from 0.52 to 0.67 in the overall sample. However, in females under 50, several equations (eg, Gallagher 2000, Deurenberg 1991 and 1998, ECORE BF) reached excellent discriminative ability (c-indices 0.81), including BMI (c-index 0.80). This pattern was not observed in other subgroups.
Conclusion: In this clinical cohort, BMI was associated poorly with AHI; however, the other equations did not outperform BMI. Moreover, BMI demonstrated poor discriminative ability for moderate/severe and severe OSA, with none of the other equations performing better in this context. Notable subgroup differences-particularly among younger females-suggest that tailoring screening strategies by age and sex may improve risk stratification and support refining obesity-based screening approaches.
Keywords: adiposity; apnea–hypopnea index; body mass index; discriminative ability; equations; obstructive sleep apnea; sex and age stratification.
© 2025 Wadden et al.
Figures

Similar articles
-
Polysomnography in patients with obstructive sleep apnea: an evidence-based analysis.Ont Health Technol Assess Ser. 2006;6(13):1-38. Epub 2006 Jun 1. Ont Health Technol Assess Ser. 2006. PMID: 23074483 Free PMC article.
-
[The role of body fat rate in the evaluation of obstructive sleep apnea].Zhonghua Er Bi Yan Hou Tou Jing Wai Ke Za Zhi. 2019 Jun 7;54(6):427-431. doi: 10.3760/cma.j.issn.1673-0860.2019.06.006. Zhonghua Er Bi Yan Hou Tou Jing Wai Ke Za Zhi. 2019. PMID: 31262107 Chinese.
-
Age-specific markers of adiposity in patients with obstructive sleep apnea.Sleep Med. 2021 Jul;83:196-203. doi: 10.1016/j.sleep.2021.02.051. Epub 2021 Mar 3. Sleep Med. 2021. PMID: 34044357
-
Obstructive sleep apnea in patients undergoing bariatric surgery--a tertiary center experience.Obes Surg. 2011 Mar;21(3):316-27. doi: 10.1007/s11695-009-9928-1. Epub 2009 Aug 11. Obes Surg. 2011. PMID: 19669842
-
Comparing Ways to Identify Sleep Apnea in People with Traumatic Brain Injury during Inpatient Rehabilitation [Internet].Washington (DC): Patient-Centered Outcomes Research Institute (PCORI); 2021 Sep. Washington (DC): Patient-Centered Outcomes Research Institute (PCORI); 2021 Sep. PMID: 39383272 Free Books & Documents. Review.
References
LinkOut - more resources
Full Text Sources
Miscellaneous
