

Bioinformatics analysis to investigate the potential relationship between mitochondrial structure and function-related genes and the immune microenvironment in atherosclerosis
- PMID: 40433124
- PMCID: PMC12106394
- DOI: 10.3389/fcvm.2025.1526151
Bioinformatics analysis to investigate the potential relationship between mitochondrial structure and function-related genes and the immune microenvironment in atherosclerosis
Abstract
Objective: This study aims to elucidate the interactions between genes associated with mitochondrial structure and function and the immune microenvironment in atherosclerosis.
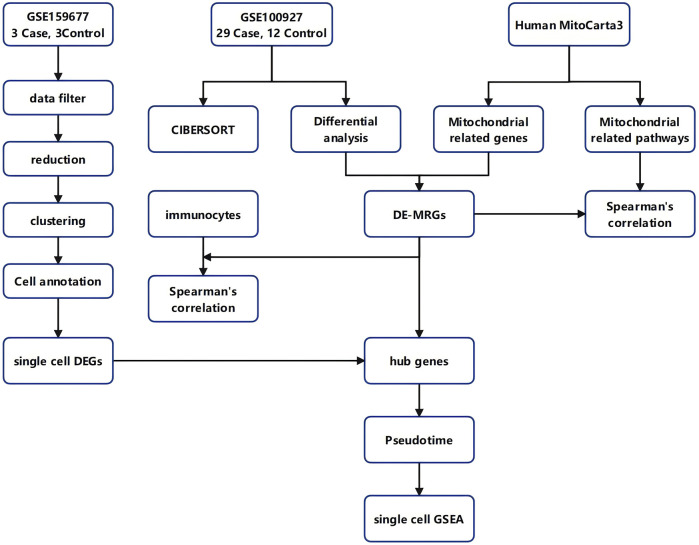
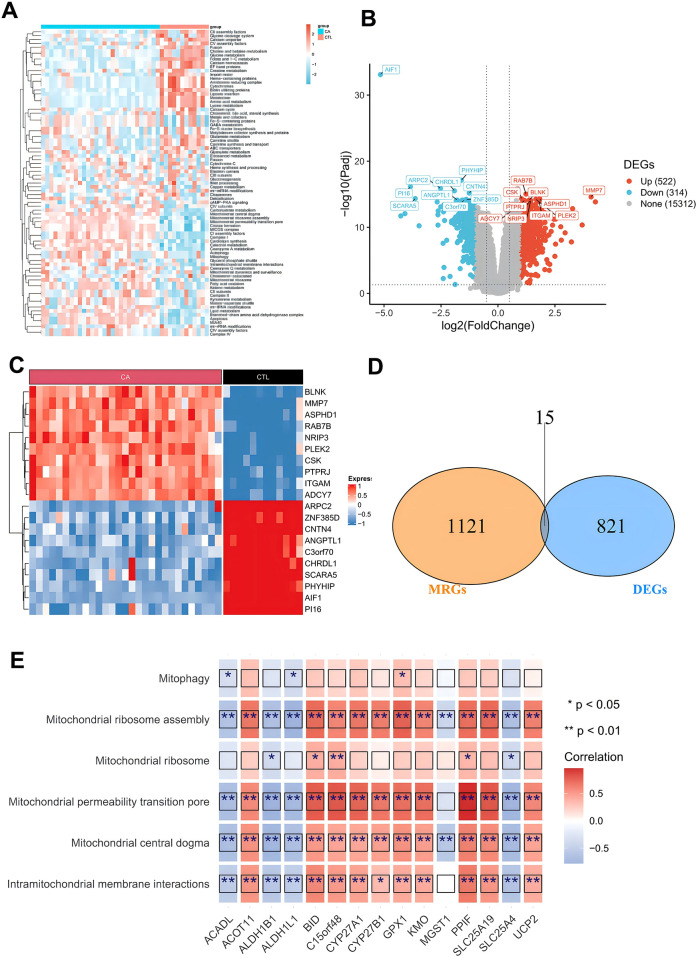
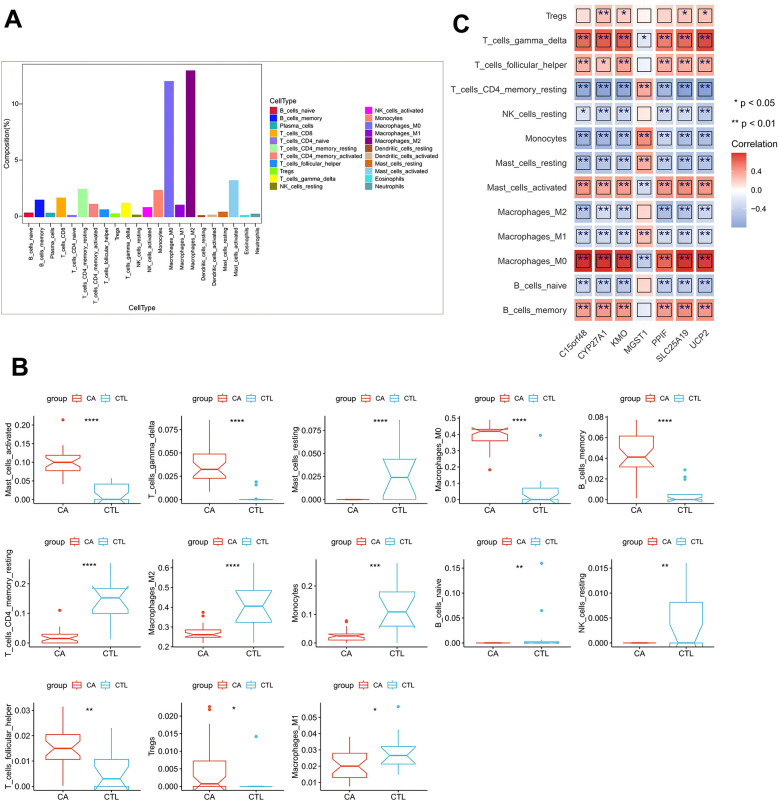
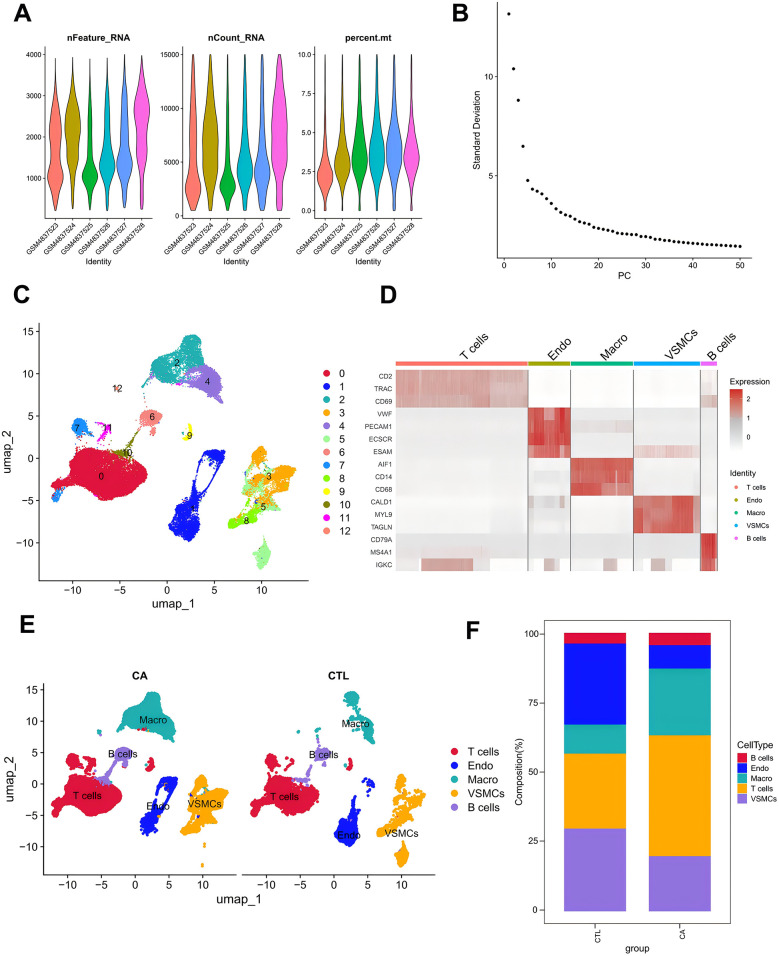
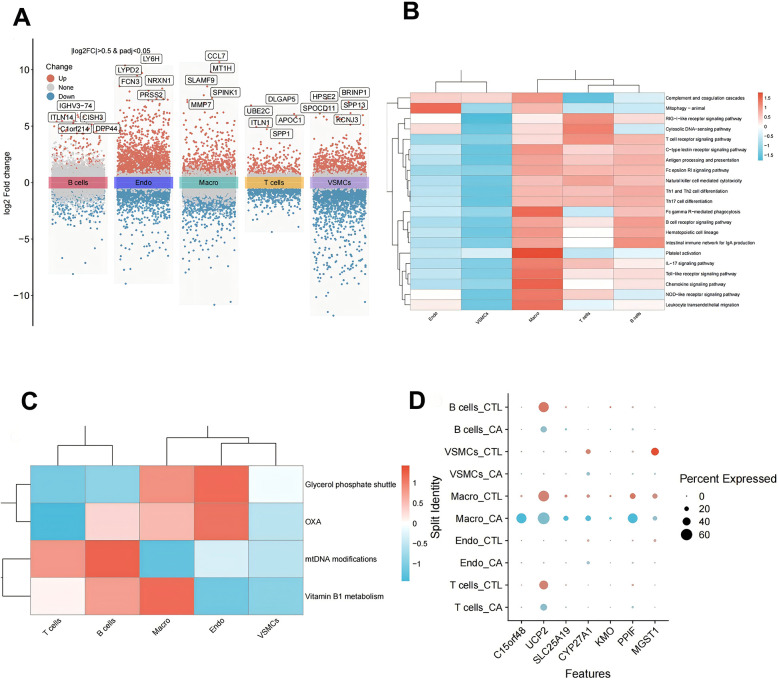
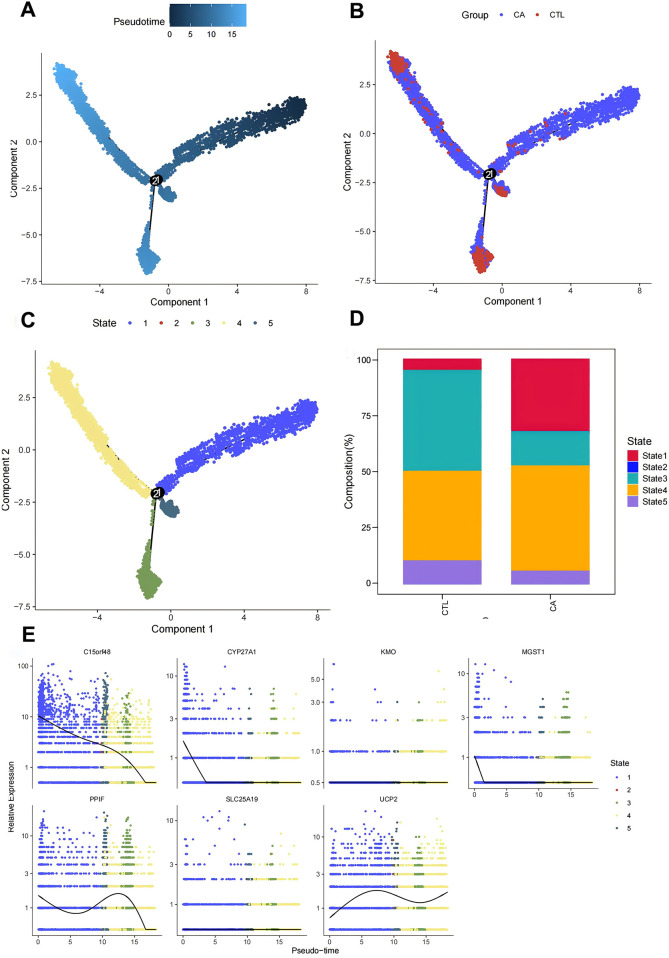
Methods: Differentially expressed mitochondria-related genes (DE-MRGs) were identified through the analysis of two gene expression datasets, GSE100927 and GSE159677, in conjunction with a list of mitochondria-related genes sourced from the MitoCarta3.0 database. The immune profile of infiltrating immune cells in atherosclerotic carotid artery (CA) patients compared to controls (CTLs) was assessed using CIBERSORT. Potential target genes were screened based on Spearman correlation analysis between specific DE-MRGs and differentially expressed immune cells. Furthermore, the correlation between characterized DE-MRGs and immune cells in AS was examined at the single-cell level, and the expression of key genes was validated in vitro.
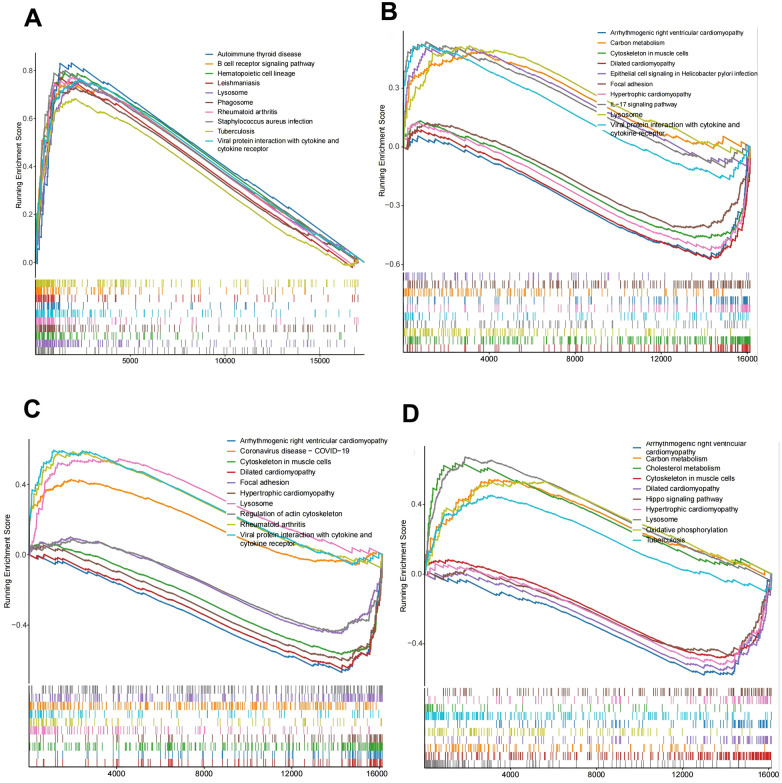
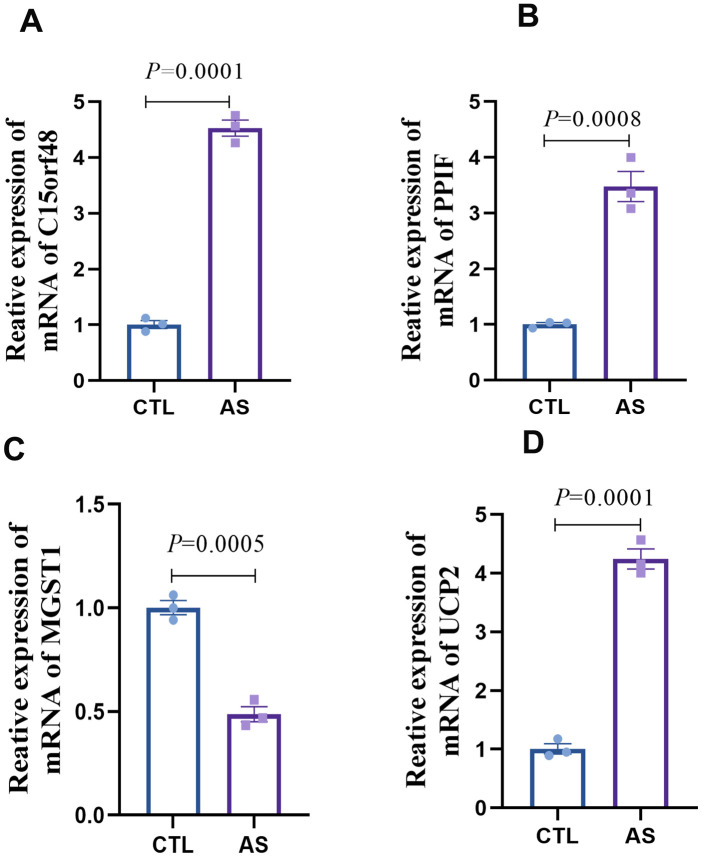
Results: Our study identified a robust association between four key genes-C15orf48, UCP2, PPIF, and MGST1-among 15 DE-MRGs, and immune macrophage polarization. These genes exhibited alterations corresponding to the degree of macrophage differentiation in AS. Additionally, Gene Set Enrichment Analysis (GSEA) revealed that C15orf48, UCP2, PPIF, and MGST1 modulate multiple immune pathways within the body. The mRNA expression levels of these four key genes in AS were confirmed via quantitative real-time PCR (qRT-PCR), with results aligning with bioinformatics predictions. Compared to the control group, the expression levels of C15orf48, UCP2, and PPIF were significantly elevated in AS macrophages, whereas MGST1 expression was notably reduced in AS macrophages. Consequently, these mitochondria-related genes-C15orf48, UCP2, PPIF, and MGST1-may influence the immune microenvironment in AS by modulating macrophage differentiation.
Conclusion: C15orf48, UCP2, PPIF, and MGST1 may serve as potential therapeutic targets for enhancing the atherosclerotic immune microenvironment in future interventions.
Keywords: atherosclerosis; immune microenvironment; inflammation; macrophage; mitochondria; single-cell analysis.
© 2025 Yang, Sun, Li, Tang, Wang, Li and Lu.
Conflict of interest statement
The authors declare that the research was conducted in the absence of any commercial or financial relationships that could be construed as a potential conflict of interest.
Figures
Similar articles
-
Identification and validation of three diagnostic autophagy-related genes associated with advanced plaques and immune cell infiltration in carotid atherosclerosis based on integrated bioinformatics analyses.PeerJ. 2024 Nov 22;12:e18543. doi: 10.7717/peerj.18543. eCollection 2024. PeerJ. 2024. PMID: 39588003 Free PMC article.
-
Decoding the mitochondrial connection: development and validation of biomarkers for classifying and treating systemic lupus erythematosus through bioinformatics and machine learning.BMC Rheumatol. 2023 Dec 4;7(1):44. doi: 10.1186/s41927-023-00369-0. BMC Rheumatol. 2023. PMID: 38044432 Free PMC article.
-
Identification and analysis of mitochondria-related central genes in steroid-induced osteonecrosis of the femoral head, along with drug prediction.Front Endocrinol (Lausanne). 2024 Feb 7;15:1341366. doi: 10.3389/fendo.2024.1341366. eCollection 2024. Front Endocrinol (Lausanne). 2024. PMID: 38384969 Free PMC article.
-
Identification of key mitochondria-related genes and their relevance to the immune system linking Parkinson's disease and primary Sjögren's syndrome through integrated bioinformatics analyses.Comput Biol Med. 2024 Jun;175:108511. doi: 10.1016/j.compbiomed.2024.108511. Epub 2024 Apr 23. Comput Biol Med. 2024. PMID: 38677173
-
Identification of SSBP1 as a ferroptosis-related biomarker of glioblastoma based on a novel mitochondria-related gene risk model and in vitro experiments.J Transl Med. 2022 Sep 30;20(1):440. doi: 10.1186/s12967-022-03657-4. J Transl Med. 2022. PMID: 36180956 Free PMC article.
References
LinkOut - more resources
Full Text Sources
Research Materials