Integrated metabolomics and transcriptomics unravel the biosynthZaesis mechanism of anthocyanin in postharvest red raspberry (Rubus idaeus L.)
- PMID: 40433162
- PMCID: PMC12106431
- DOI: 10.3389/fpls.2025.1549458
Integrated metabolomics and transcriptomics unravel the biosynthZaesis mechanism of anthocyanin in postharvest red raspberry (Rubus idaeus L.)
Abstract
Introduction: Anthocyanins are crucial secondary metabolites that are responsible for pigment deposition in fruits. Raspberry fruit color shifts from white to red during natural or postharvest ripening. However, the precise mechanisms and biosynthetic pathways of anthocyanins in postharvest raspberries remain unclear.
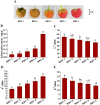
Methods: This study used metabolomic and transcriptomic analyses to explore anthocyanin biosynthesis in postharvest raspberries at various color stages: white (RBT-1), white-to-pink (RBT-2), pink (RBT-3), red (RBT-4), and deep red (RBT-5).
Results: We identified 43 key metabolites, and 13,239 DEGs linked to anthocyanin biosynthesis in postharvest raspberry colour development, including cyanidin-3-O-sophoroside and cyanidin-3-O-glucoside. The key DAMs in colored raspberries were gentiobioside, pelargonidin-3,5-O-diglucoside, cyanidin-3-O-sambubioside, and pelargonidin-3-O-sambubioside. Transcriptome analysis revealed 32 differentially expressed structural genes linked to anthocyanin and flavonoid synthesis, with significant upregulation of PAL, CHS, F3H, C4H, F3'H, DFR, ANS, CHI, and UFGT genes, which promote anthocyanin synthesis and pigment accumulation. Integrated analysis showed that cyanidin-3-O-sophoroside was correlated with 9 structural genes involved in anthocyanin biosynthesis, 19 transcription factors (TFs), and 14 hormone signaling-related genes.
Discussion: This study explored the regulatory mechanisms of MYB, WRKY, bHLH, and NAC transcription factors, as well as structural genes and phytohormone-related genes, in modulating anthocyanin metabolism during postharvest color changes in raspberries. The findings provide valuable insights for optimizing postharvest fruit storage conditions and enhancing fruit quality.
Keywords: anthocyanin; color variation; metabolome; raspberry; transcriptome.
Copyright © 2025 Sun, Cui, Liu, Qian, Zhu and Li.
Conflict of interest statement
The authors declare that the research was conducted in the absence of any commercial or financial relationships that could be construed as a potential conflict of interest.
Figures


Similar articles
-
Transcriptomic and metabolomic analyses reveal molecular and metabolic regulation of anthocyanin biosynthesis in three varieties of currant.Food Res Int. 2024 Nov;196:115056. doi: 10.1016/j.foodres.2024.115056. Epub 2024 Sep 7. Food Res Int. 2024. PMID: 39614491
-
Integrated metabolome and transcriptome analyses reveal the role of BoGSTF12 in anthocyanin accumulation in Chinese kale (Brassica oleracea var. alboglabra).BMC Plant Biol. 2024 Apr 25;24(1):335. doi: 10.1186/s12870-024-05016-5. BMC Plant Biol. 2024. PMID: 38664614 Free PMC article.
-
An in-depth study of anthocyanin synthesis in the exocarp of virescens and nigrescens oil palm: metabolomic and transcriptomic analysis.BMC Plant Biol. 2024 Sep 30;24(1):910. doi: 10.1186/s12870-024-05607-2. BMC Plant Biol. 2024. PMID: 39349997 Free PMC article.
-
Integrated metabolomic and transcriptomic analysis of the anthocyanin regulatory networks in Lagerstroemia indica petals.BMC Plant Biol. 2025 Mar 12;25(1):316. doi: 10.1186/s12870-025-06350-y. BMC Plant Biol. 2025. PMID: 40075284 Free PMC article.
-
Integrated metabolomic and transcriptomic analysis of the anthocyanin and proanthocyanidin regulatory networks in red walnut natural hybrid progeny leaves.PeerJ. 2022 Oct 20;10:e14262. doi: 10.7717/peerj.14262. eCollection 2022. PeerJ. 2022. PMID: 36285329 Free PMC article.
References
LinkOut - more resources
Full Text Sources
Miscellaneous

