

The carbon footprint of American Academy of Orthopaedic Surgeons and Pediatric Orthopaedic Society of North America national meetings
- PMID: 40433246
- PMCID: PMC12088109
- DOI: 10.1016/j.jposna.2024.100011
The carbon footprint of American Academy of Orthopaedic Surgeons and Pediatric Orthopaedic Society of North America national meetings
Abstract
Background: The health care sector contributes substantially to carbon emissions. Estimating the carbon emissions of an event can help determine its climate impact. This study calculates the carbon footprints of the 2019 American Academy of Orthopaedic Surgeons (AAOS) Annual Meeting and the 2019 Pediatric Orthopaedic Society of North America (POSNA) Annual Meeting.
Methods: Data regarding attendance volume, geographic origin of attendees and vendors, hotel room nights, event space, and duration of meetings were obtained from AAOS and POSNA. Data were entered into an online calculator designed to measure the carbon footprint of large events (www.terrapass.com).
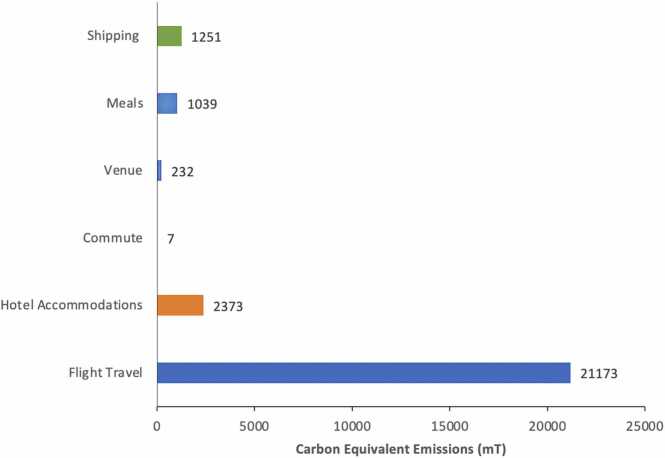
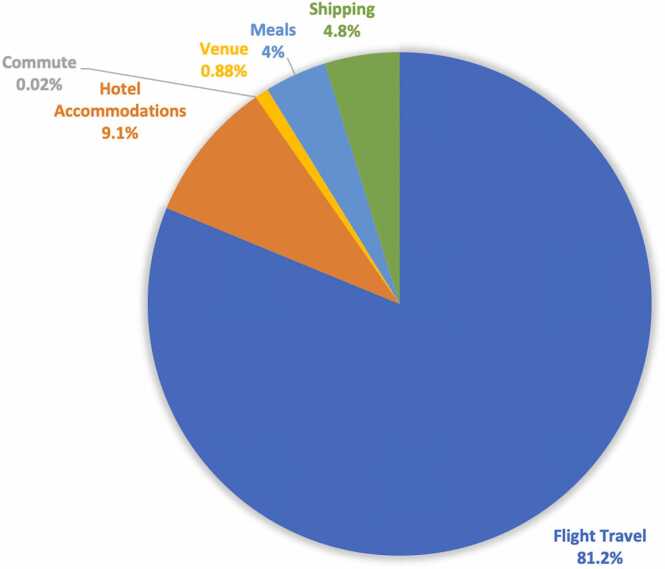
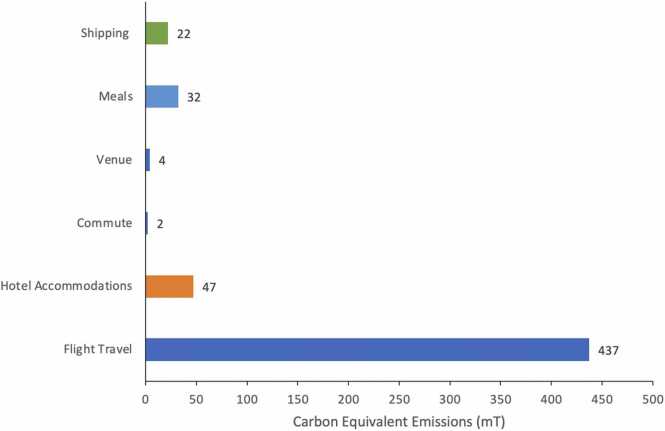
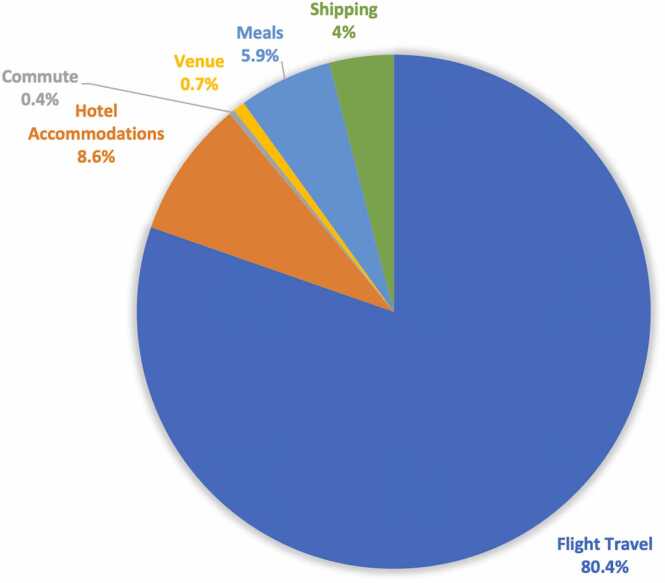
Results: The AAOS 2019 annual meeting was attended by 29 448 people, requiring 66 000 hotel room nights and 2 308 800 ft2 of convention center space for 5 days. We estimated 7179 short, 8374 medium, and 13 421 long-haul round-trip flights. The POSNA 2019 annual meeting was attended by 1103 people, requiring 1932 hotel room nights and 52 100 ft2 of convention center space for 4 days. We estimated 501 short, 280 medium, and 280 long-haul round-trip flights. The AAOS 2019 meeting emitted 26 075 metric tonnes of carbon dioxide equivalents (CO2e), while the POSNA 2019 meeting emitted 544 metric tonnes. Eighty-one percent of the carbon emissions from AAOS and 80% from POSNA came from flight travel alone. Carbon neutralization of in-person AAOS and POSNA annual meetings would require carbon-offset purchases of approximately $273 700 and $5700, respectively.
Conclusions: Annual orthopaedic meetings contribute to climate change through their large carbon footprint. Leaders in the field of orthopaedics should consider strategies to mitigate the impact of such meetings, examples of which include transitioning to hybrid formats when appropriate and by purchasing carbon offsets for essential in-person participation.
Key concepts: 1)Calculating the carbon footprint of an event estimates its total carbon dioxide emissions to help determine how to reduce its climate impact.2)The AAOS 2019 meeting emitted 26 075 metric tonnes (MT) of carbon dioxide equivalents (CO2e), while the POSNA 2019 meeting emitted 544MT, with ∼80% coming from air travel alone.3)Carbon neutralization of in-person AAOS and POSNA annual meetings would require carbon-offset purchases of approximately $273 700 and $5700, respectively.
Level of evidence: IV.
Keywords: AAOS and POSNA annual meetings; Carbon emissions; Carbon footprint; Carbon offset; Climate change.
© 2024 The Authors.
Conflict of interest statement
The authors declare that they have no known competing financial interests or personal relationships that could have appeared to influence the work reported in this paper.
Figures
Similar articles
-
Readability of Online Pediatric Orthopaedic Trauma Patient Education Materials.J Am Acad Orthop Surg. 2025 May 1;33(9):e502-e510. doi: 10.5435/JAAOS-D-24-00617. Epub 2024 Dec 18. J Am Acad Orthop Surg. 2025. PMID: 39705807
-
Assessing Strategies to Reduce the Carbon Footprint of the Annual Meeting of the American Academy of Ophthalmology.JAMA Ophthalmol. 2023 Sep 1;141(9):862-869. doi: 10.1001/jamaophthalmol.2023.3516. JAMA Ophthalmol. 2023. PMID: 37561509 Free PMC article.
-
The Carbon Cost of Travel to a Medical Conference: Modelling the Annual Meeting of the Canadian Association of Gastroenterology.J Can Assoc Gastroenterol. 2021 Jul 29;5(2):52-58. doi: 10.1093/jcag/gwab021. eCollection 2022 Apr. J Can Assoc Gastroenterol. 2021. PMID: 35368317 Free PMC article.
-
Medical conferences in the era of environmental conscientiousness and a global health crisis: The carbon footprint of presenter flights to pre-COVID pediatric urology conferences and a consideration of future options.J Pediatr Surg. 2021 Aug;56(8):1312-1316. doi: 10.1016/j.jpedsurg.2020.07.013. Epub 2020 Jul 16. J Pediatr Surg. 2021. PMID: 32782130 Free PMC article. Review.
-
Gender Representation in Major Orthopaedic Surgery Meetings: A Quantitative Analysis.JB JS Open Access. 2023 Nov 2;8(4):e23.00067. doi: 10.2106/JBJS.OA.23.00067. eCollection 2023 Oct-Dec. JB JS Open Access. 2023. PMID: 37920560 Free PMC article. Review.
References
-
- Xu R., Yu P., Abramson M.J., Johnston F.H., Samet J.M. Bell M.L.,et al. Wildfires, global climate change, and human health. N Engl J Med. 2020;383:2173–2181. - PubMed
-
- Atwoli L., Baqui A.H., Benfield T., Bosurgi R., Godlee F., Hancocks S., et al. Call for emergency action to limit global temperature increases, restore biodiversity, and protect health. N Engl J Med. 2021;385:1134–1137. - PubMed
-
- Sommer L. Climate Change Is The Greatest Threat To Public Health, Top Medical Journals Warn. NPR. https://www.npr.org/2021/09/07/1034670549/climate-change-is-the-greatest... (accessed September 7, 2021).
-
- Philipsborn R.P., Chan K. Climate change and global child health. Pediatrics. 2018;141(6) - PubMed
LinkOut - more resources
Full Text Sources
Research Materials
