

Identification and validation of tissue-based gene biomarkers for acute intestinal graft-versus-host disease(AIGVHD)
- PMID: 40433377
- PMCID: PMC12106017
- DOI: 10.3389/fimmu.2025.1574904
Identification and validation of tissue-based gene biomarkers for acute intestinal graft-versus-host disease(AIGVHD)
Abstract
Background: Acute intestinal graft-versus-host disease (AIGVHD) is a common complication of allogeneic hematopoietic stem cell transplantation (allo HSCT) with a high mortality rate. The primary aim of the present study is to identify tissue-based gene biomarkers pertinent to AIGVHD, thereby facilitating early diagnosis and exploration of potential therapeutic targets.
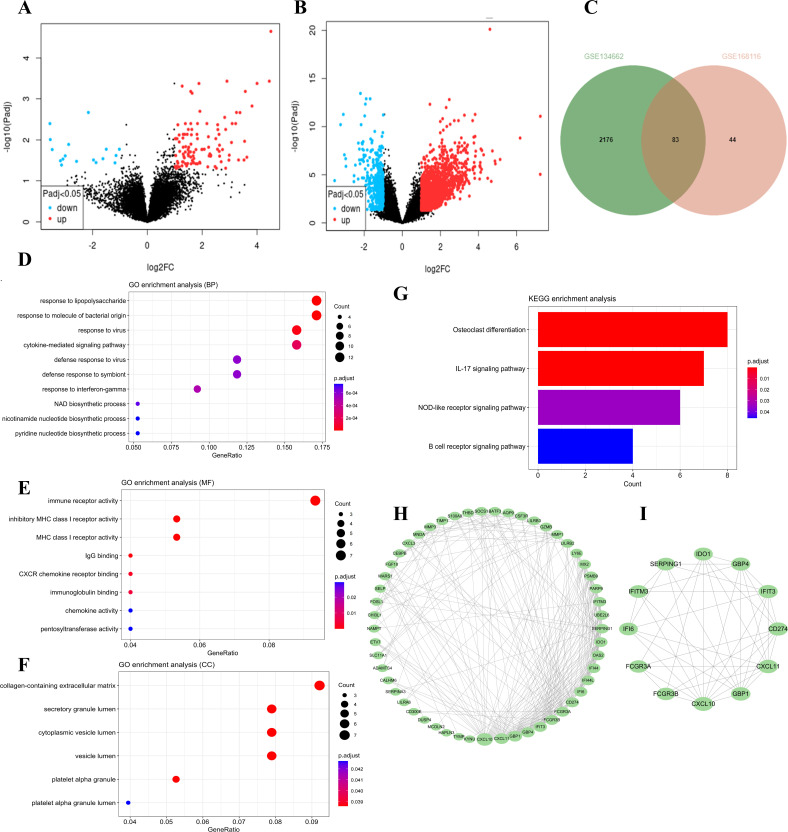
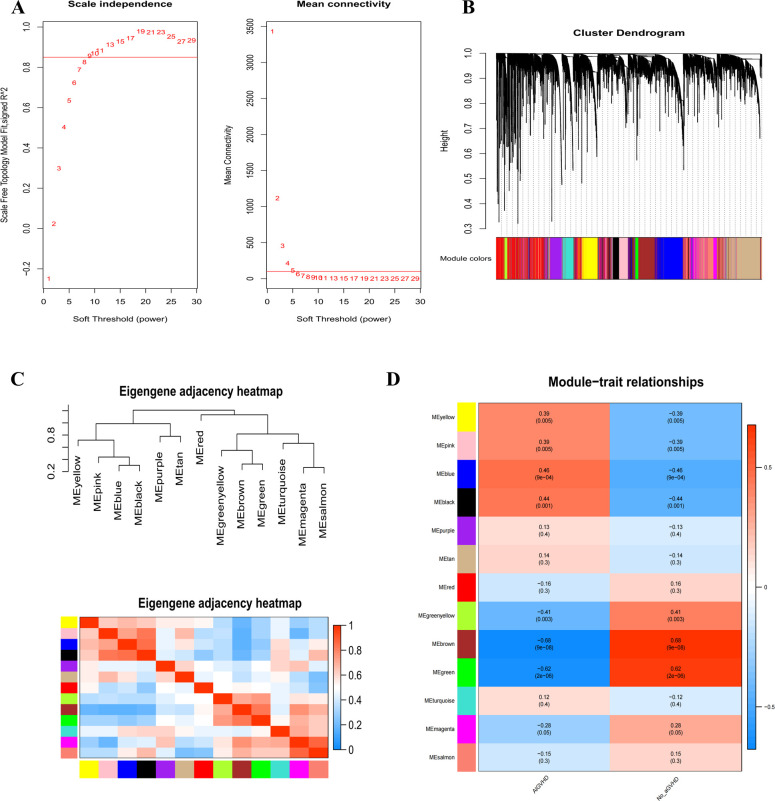
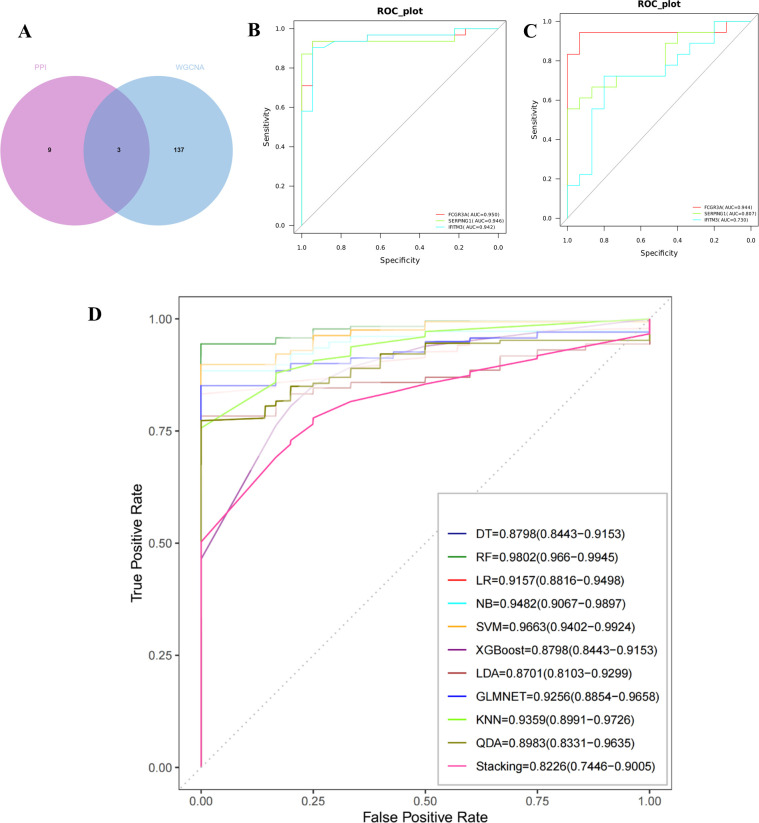
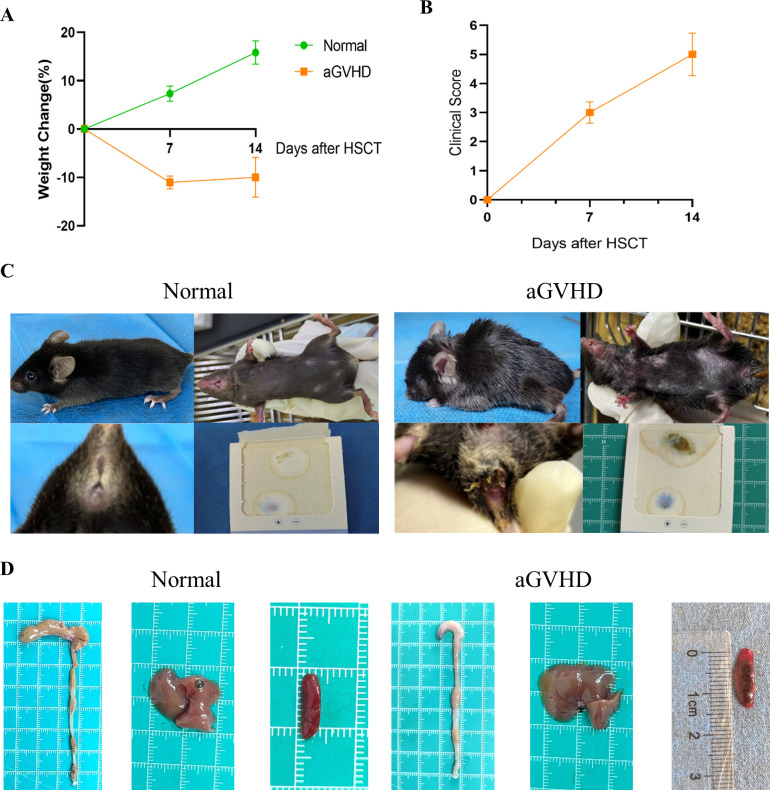
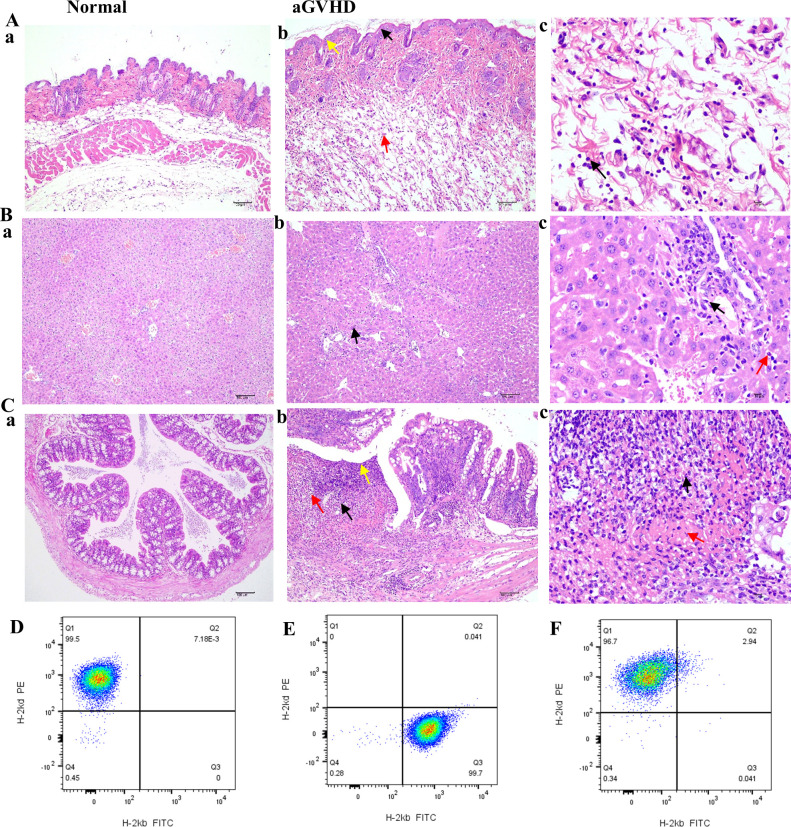
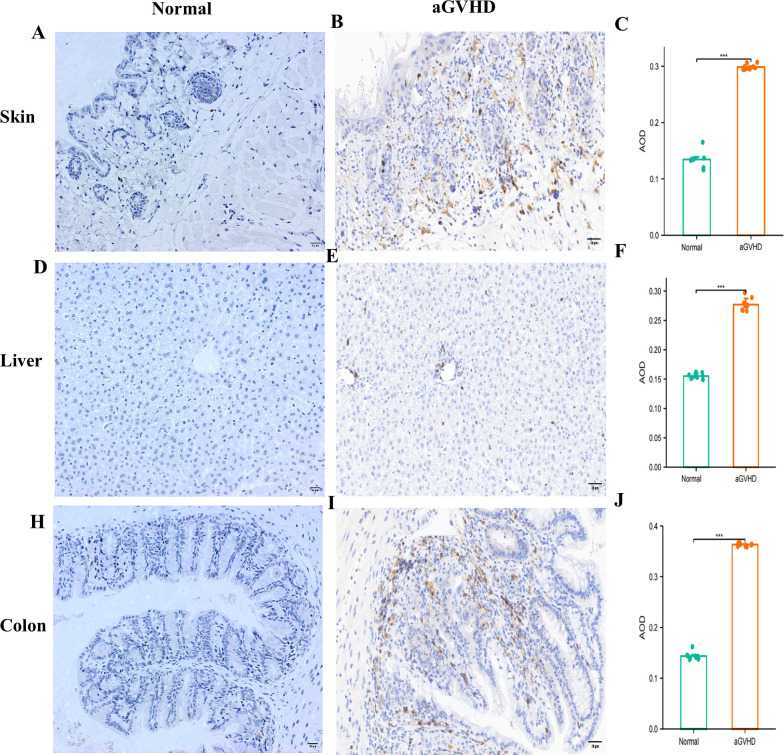
Method: The dataset was obtained from the GEO database. DEGs were identified, followed by GO and KEGG pathways analysis for the common DEGs. PPI networks and WGCNA analysis were used to identify essential genes, and correlations between critical genes and immune cell infiltration were also examined. The diagnostic efficacy of these essential genes was evaluated using ROC curves, leading to the development of 11 machine learning models based on this gene set. Furthermore, we established a mouse model of aGVHD, which was identified by clinical score, pathological analysis, flow cytometry detection of implantation rate, and immunohistochemical detection of CD4 expression. Finally, we measured the mRNA expression levels of the key genes in the mice's intestinal tissue using real-time PCR.
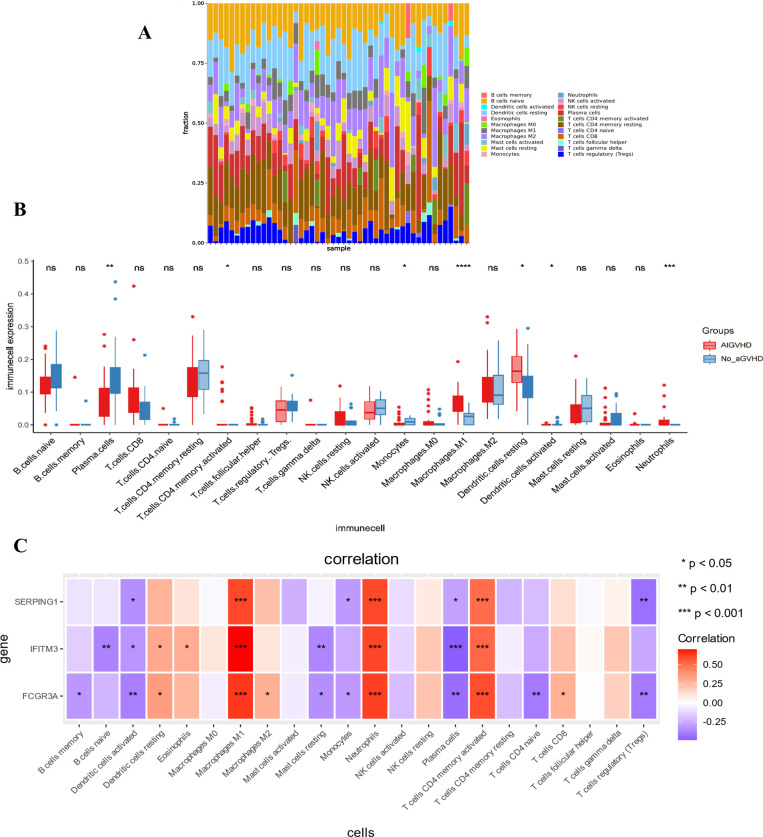
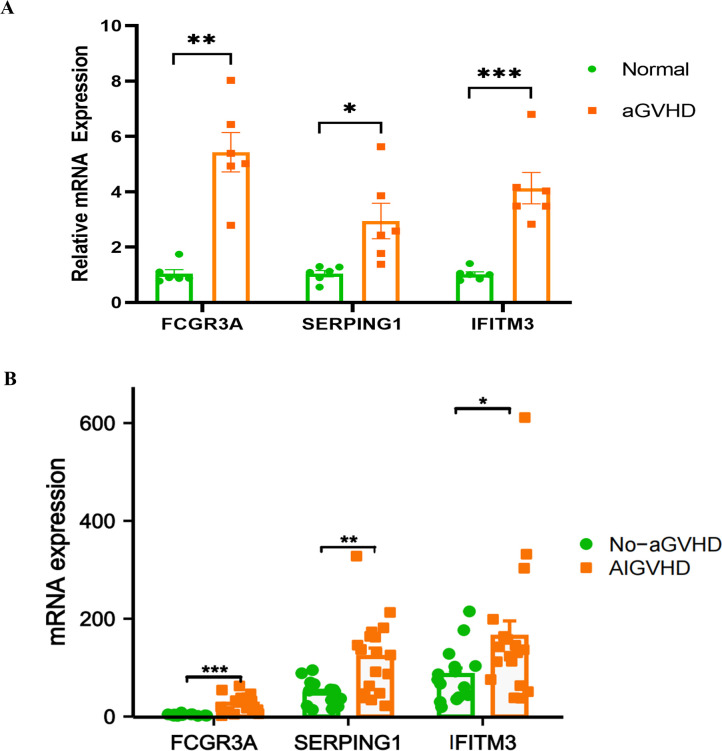
Result: DEGs showed a marked enrichment in immune and inflammatory response pathways. Our analysis identified three key genes, FCGR3A, SERPING1, and IFITM3, which were positively associated with M1 macrophage and neutrophil infiltration. Subsequently, we developed machine learning models utilizing these three genes and found that the RF model exhibited a robust predictive capacity for AIGVHD occurrence, achieving an AUC of 0.9802 (95% CI: 0.966-0.9945). An aGVHD mouse model was also successfully created, and we discovered that the aGVHD group's mRNA expression levels of three key genes were noticeably higher than the control group's.
Conclusion: In this study, we identified FCGR3A, SERPING1, and IFITM3 as tissue-based gene biomarkers for AIGVHD, highlighting their diagnostic efficacy. Furthermore, we confirmed the association of these genes with AIGVHD through investigations conducted in aGVHD mouse models.
Keywords: Allo HSCT; aGVHD; aGVHD mouse model; gene biomarkers; immune cell infiltration; machine learning.
Copyright © 2025 Chen, Fu, Liu and He.
Conflict of interest statement
The authors declare that the research was conducted in the absence of any commercial or financial relationships that could be construed as a potential conflict of interest.
Figures
Similar articles
-
Kinetics of Torque Teno virus DNA in stools may predict occurrence of acute intestinal graft versus host disease early after allogeneic hematopoietic stem cell transplantation.Transpl Infect Dis. 2021 Jun;23(3):e13507. doi: 10.1111/tid.13507. Epub 2020 Nov 27. Transpl Infect Dis. 2021. PMID: 33176050
-
The Potential Genes Mediate the Pathogenicity of Allogeneic CD4+T Cell in aGVHD Mouse Model.Biomed Res Int. 2021 May 7;2021:9958745. doi: 10.1155/2021/9958745. eCollection 2021. Biomed Res Int. 2021. PMID: 34036106 Free PMC article.
-
Circulating miRNA panel for prediction of acute graft-versus-host disease in lymphoma patients undergoing matched unrelated hematopoietic stem cell transplantation.Exp Hematol. 2016 Jul;44(7):624-634.e1. doi: 10.1016/j.exphem.2016.03.005. Epub 2016 Mar 21. Exp Hematol. 2016. PMID: 27013207
-
Machine Learning Classification Algorithms to Predict aGvHD following Allo-HSCT: A Systematic Review.Methods Inf Med. 2019 Dec;58(6):205-212. doi: 10.1055/s-0040-1709150. Epub 2020 Apr 29. Methods Inf Med. 2019. PMID: 32349154
-
Acute Graft-Versus-Host Disease: A Brief Review.Turk J Haematol. 2020 Feb 20;37(1):1-4. doi: 10.4274/tjh.galenos.2019.2019.0157. Epub 2019 Sep 2. Turk J Haematol. 2020. PMID: 31475512 Free PMC article. Review.
References
-
- Penack O, Marchetti M, Aljurf M, Arat M, Bonifazi F, Duarte RF, et al. . Prophylaxis and management of graft-versus-host disease after stem-cell transplantation for haematological Malignancies: updated consensus recommendations of the European Society for Blood and Marrow Transplantation. Lancet Haematol. (2024) 11:e147–e59. doi: 10.1016/s2352-3026(23)00342-3 - DOI - PubMed
-
- Zhang XH, Chen J, Han MZ, Huang H, Jiang EL, Jiang M, et al. . The consensus from The Chinese Society of Hematology on indications, conditioning regimens and donor selection for allogeneic hematopoietic stem cell transplantation: 2021 update. J Hematol Oncol. (2021) 14:145. doi: 10.1186/s13045-021-01159-2 - DOI - PMC - PubMed
-
- Passweg JR, Baldomero H, Chabannon C, Basak GW, de la Cámara R, Corbacioglu S, et al. . Hematopoietic cell transplantation and cellular therapy survey of the EBMT: monitoring of activities and trends over 30 years. Bone Marrow Transpl. (2021) 56:1651–64. doi: 10.1038/s41409-021-01227-8 - DOI - PMC - PubMed
-
- Niederwieser D, Baldomero H, Bazuaye N, Bupp C, Chaudhri N, Corbacioglu S, et al. . One and a half million hematopoietic stem cell transplants: continuous and differential improvement in worldwide access with the use of non-identical family donors. Haematologica. (2022) 107:1045–53. doi: 10.3324/haematol.2021.279189 - DOI - PMC - PubMed
MeSH terms
Substances
LinkOut - more resources
Full Text Sources
Research Materials
Miscellaneous