

CDT1 is a Potential Therapeutic Target for the Progression of NAFLD to HCC and the Exacerbation of Cancer
- PMID: 40433415
- PMCID: PMC12107793
- DOI: 10.2174/0113892029313473240919105819
CDT1 is a Potential Therapeutic Target for the Progression of NAFLD to HCC and the Exacerbation of Cancer
Abstract
Aims: This study aimed to identify potential therapeutic targets in the progression from non-alcoholic fatty liver disease (NAFLD) to hepatocellular carcinoma (HCC), with a focus on genes that could influence disease development and progression.
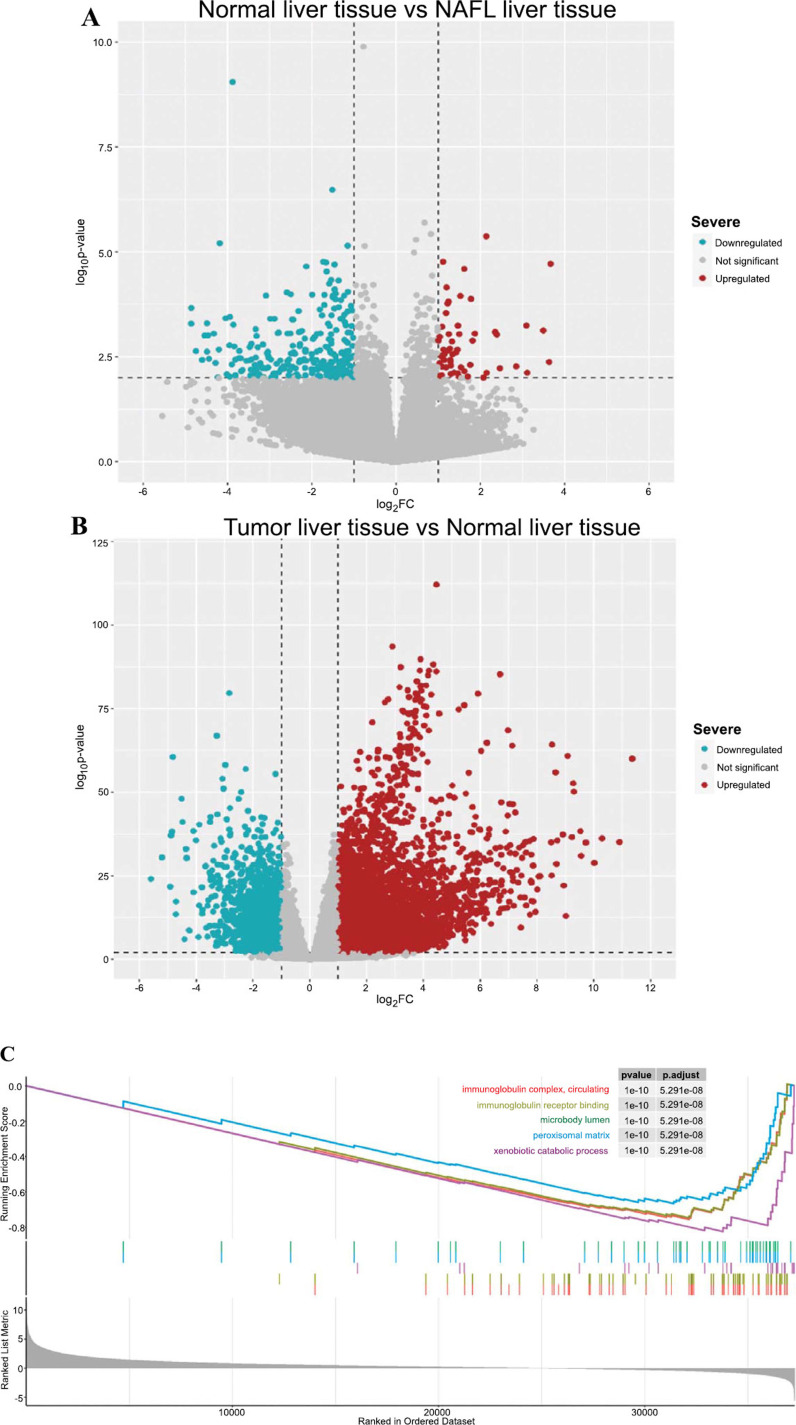
Background: Hepatocellular carcinoma, significantly driven by non-alcoholic fatty liver disease, represents a major global health challenge due to late-stage diagnosis and limited treatment options. This study utilized bioinformatics to analyze data from GEO and TCGA, aiming to uncover molecular biomarkers that bridge NAFLD to HCC. Through identifying critical genes and pathways, our research seeks to advance early detection and develop targeted therapies, potentially improving prognosis and personalizing treatment for NAFLD-HCC patients.
Objectives: Identify key genes that differ between NAFLD and HCC; Analyze these genes to understand their roles in disease progression; Validate the functions of these genes in NAFLD to HCC transition.
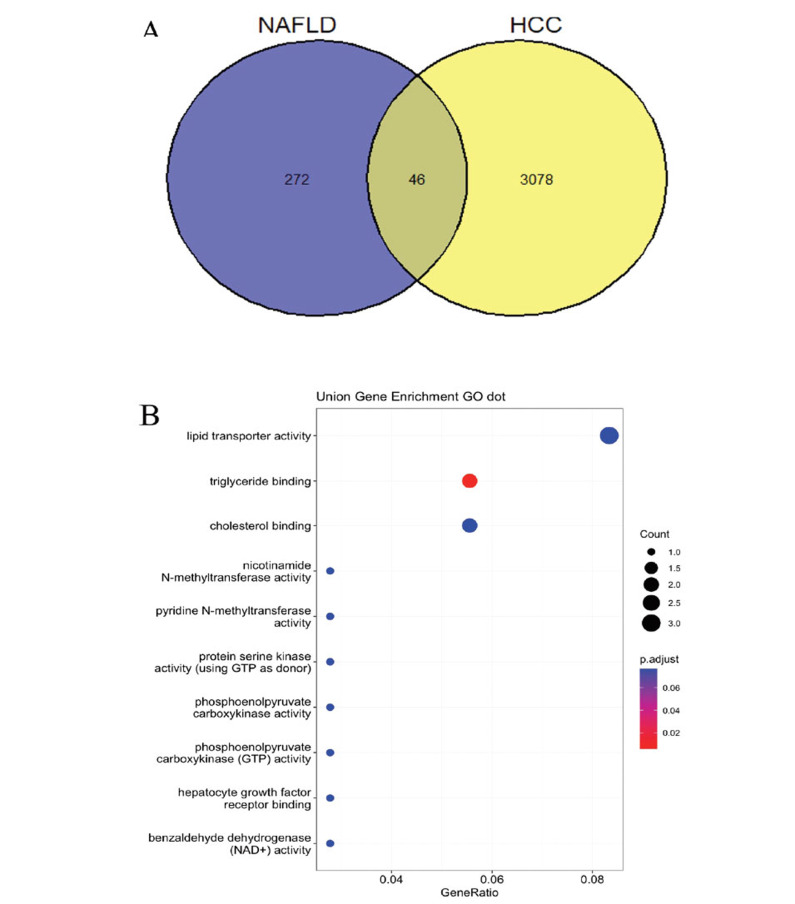
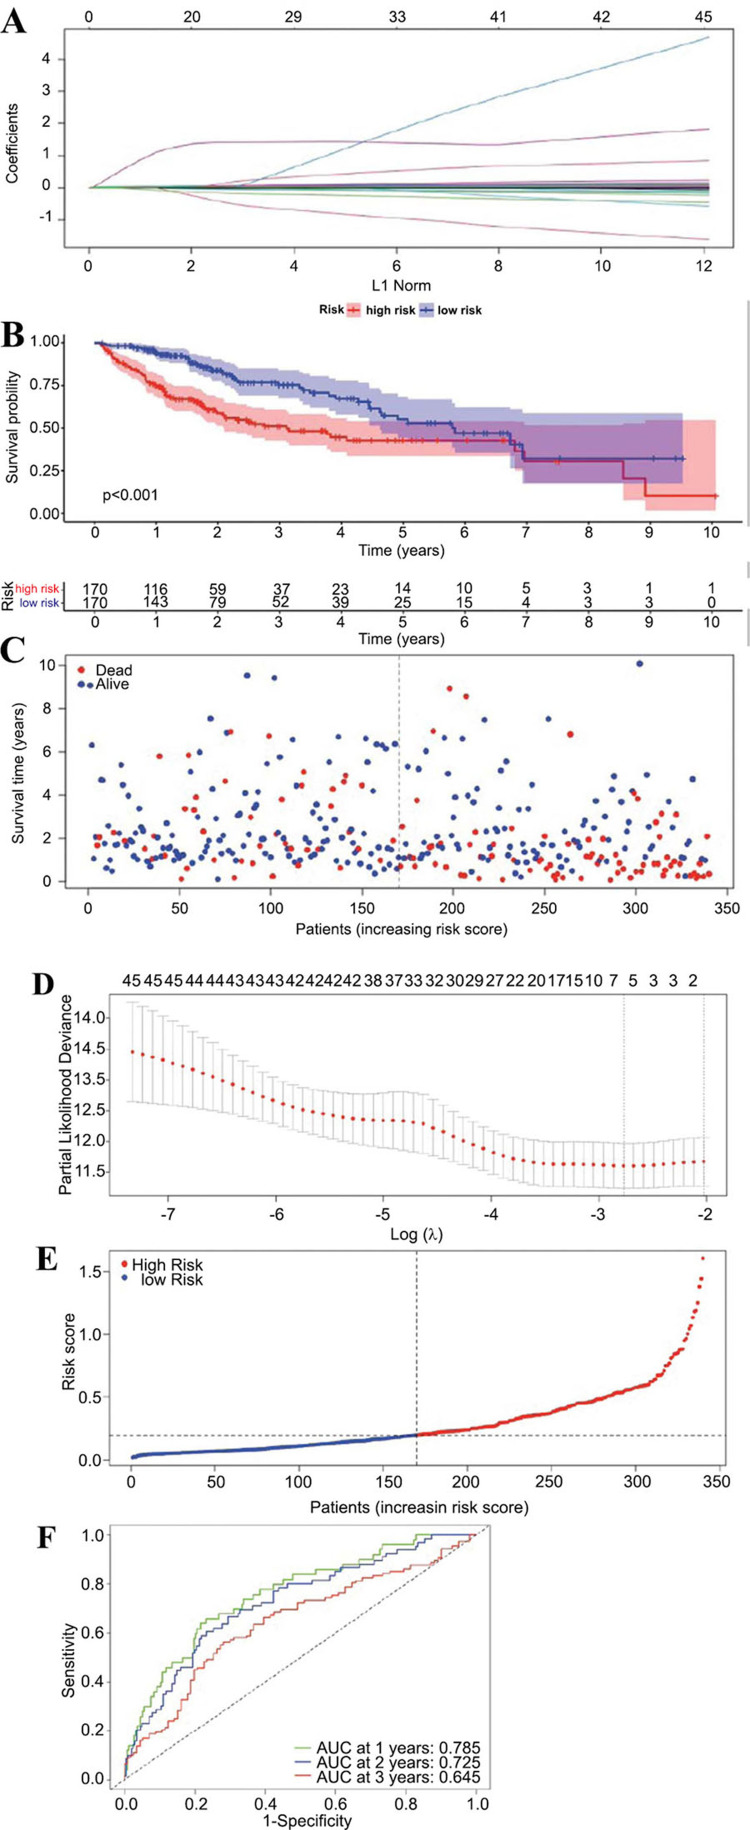
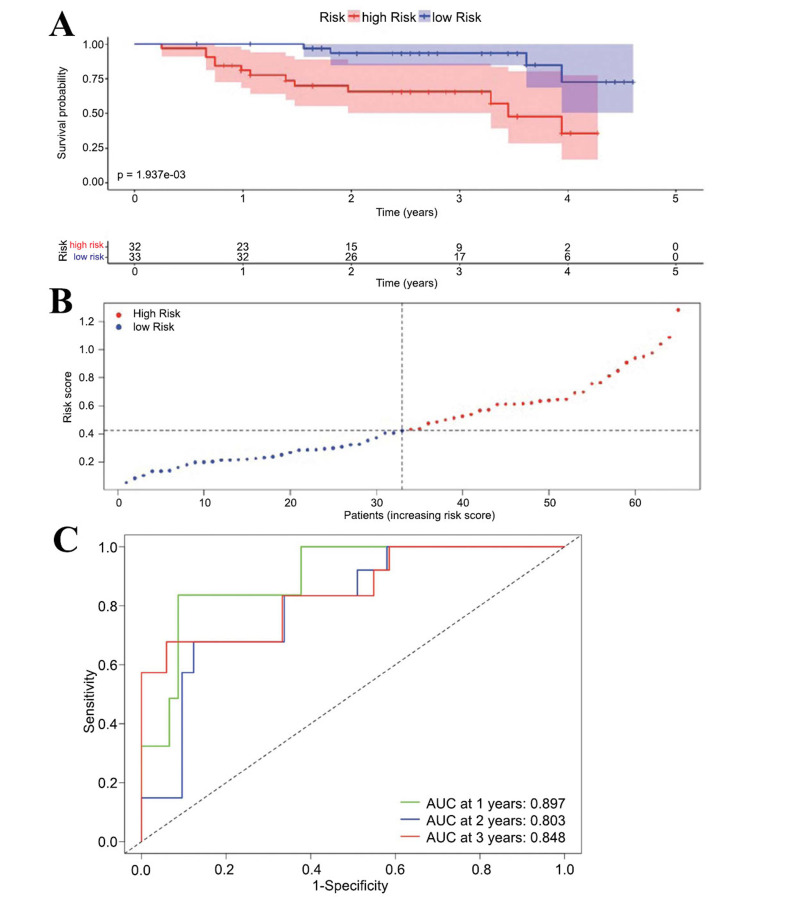
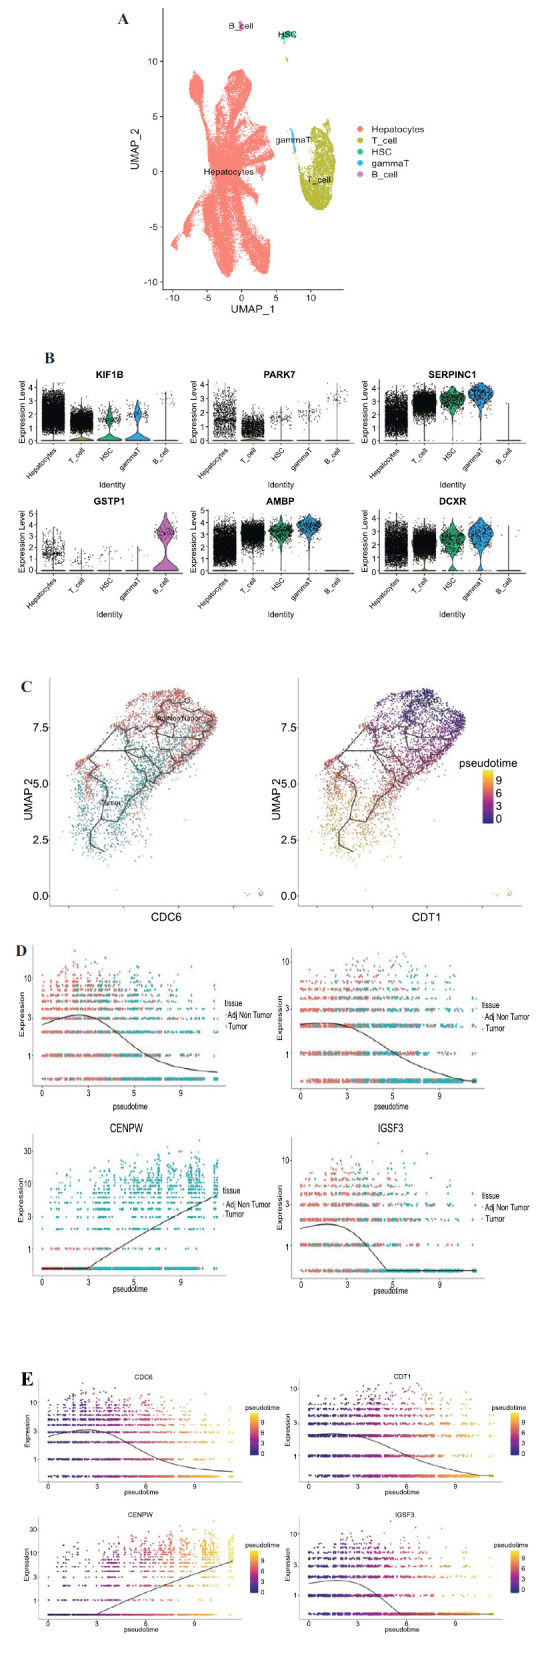
Methods: Initially, we identified a set of genes differentially expressed in both NAFLD and HCC using second-generation sequencing data from the GEO and TCGA databases. We then employed a Cox proportional hazards model and a Lasso regression model, applying machine learning techniques to the large sample data from TCGA. This approach was used to screen for key disease-related genes, and an external dataset was utilized for model validation. Additionally, pseudo-temporal sequencing analysis of single-cell sequencing data was performed to further examine the variations in these genes in NAFLD and HCC.
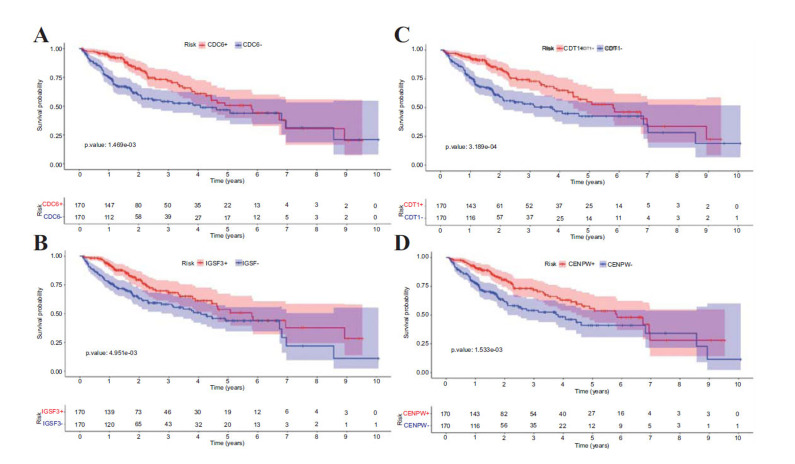
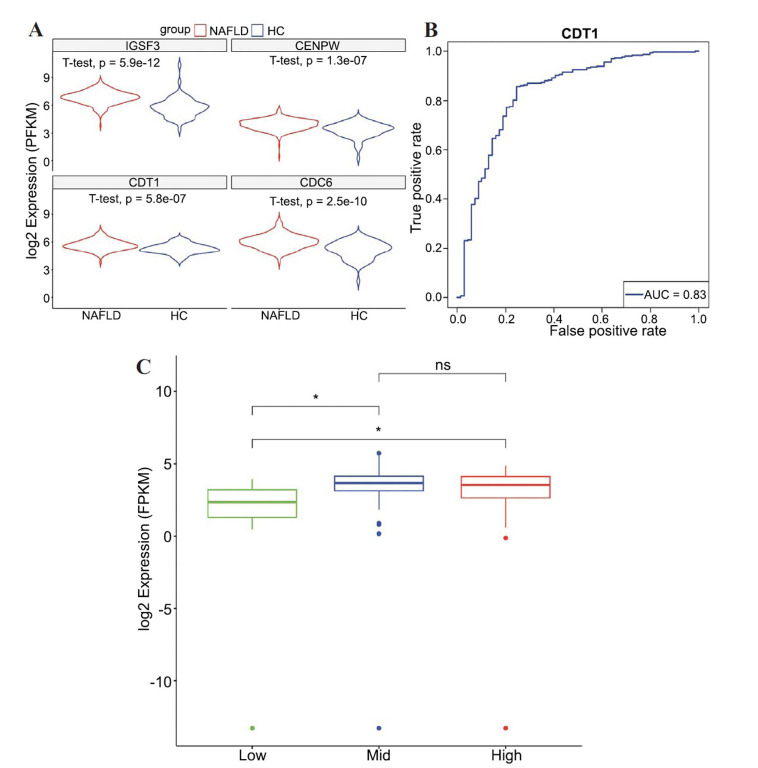
Results: The machine learning analysis identified IGSF3, CENPW, CDT1, and CDC6 as key genes. Furthermore, constructing a machine learning model for CDT1 revealed it to be the most critical gene, with model validation yielding an ROC value greater than 0.80. The single-cell sequencing data analysis confirmed significant variations in the four predicted key genes between the NAFLD and HCC groups.
Conclusion: Our study underscores the pivotal role of CDT1 in the progression from NAFLD to HCC. This finding opens new avenues for early diagnosis and targeted therapy of HCC, highlighting CDT1 as a potential therapeutic target.
Keywords: CDT1; Nonalcoholic fatty liver disease; early diagnosis; hepatocellular carcinoma; machine learning; single-cell sequencing.
© 2025 The Author(s). Published by Bentham Science Publisher.
Conflict of interest statement
The authors declare no conflict of interest, financial or otherwise.
Figures
Similar articles
-
Identification of CACNB1 protein as an actionable therapeutic target for hepatocellular carcinoma via metabolic dysfunction analysis in liver diseases: An integrated bioinformatics and machine learning approach for precise therapy.Int J Biol Macromol. 2025 May;308(Pt 2):142315. doi: 10.1016/j.ijbiomac.2025.142315. Epub 2025 Mar 25. Int J Biol Macromol. 2025. PMID: 40139615
-
Integrative analysis identifies oxidative stress biomarkers in non-alcoholic fatty liver disease via machine learning and weighted gene co-expression network analysis.Front Immunol. 2024 Feb 27;15:1335112. doi: 10.3389/fimmu.2024.1335112. eCollection 2024. Front Immunol. 2024. PMID: 38476236 Free PMC article.
-
Characterizing the key genes of COVID-19 that regulate tumor immune microenvironment and prognosis in hepatocellular carcinoma.Funct Integr Genomics. 2023 Aug 4;23(3):262. doi: 10.1007/s10142-023-01184-z. Funct Integr Genomics. 2023. PMID: 37540264
-
The role of dietary factors in nonalcoholic fatty liver disease to hepatocellular carcinoma progression: A systematic review.Clin Nutr. 2022 Oct;41(10):2295-2307. doi: 10.1016/j.clnu.2022.08.018. Epub 2022 Aug 24. Clin Nutr. 2022. PMID: 36096063
-
The Emerging Factors and Treatment Options for NAFLD-Related Hepatocellular Carcinoma.Cancers (Basel). 2021 Jul 26;13(15):3740. doi: 10.3390/cancers13153740. Cancers (Basel). 2021. PMID: 34359642 Free PMC article. Review.
References
-
- Fitzmaurice C., Allen C., Barber R.M., Barregard L., Bhutta Z.A., Brenner H., Dicker D.J., Chimed-Orchir O., Dandona R., Dandona L. Global, Regional, and National Cancer Incidence, Mortality, Years of Life Lost, Years Lived With Disability, and Disability-Adjusted Life-years for 32 Cancer Groups, 1990 to 2015: A Systematic Analysis for the Global Burden of Disease Study. JAMA Oncol. 2017;3(4):524–548. doi: 10.1001/jamaoncol.2016.5688. - DOI - PMC - PubMed
-
- Estes C., Anstee Q.M., Arias-Loste M.T., Bantel H., Bellentani S., Caballeria J., Colombo M., Craxi A., Crespo J., Day C.P., Eguchi Y., Geier A., Kondili L.A., Kroy D.C., Lazarus J.V., Loomba R., Manns M.P., Marchesini G., Nakajima A., Negro F., Petta S., Ratziu V., Romero-Gomez M., Sanyal A., Schattenberg J.M., Tacke F., Tanaka J., Trautwein C., Wei L., Zeuzem S., Razavi H. Modeling NAFLD disease burden in China, France, Germany, Italy, Japan, Spain, United Kingdom, and United States for the period 2016–2030. J. Hepatol. 2018;69(4):896–904. doi: 10.1016/j.jhep.2018.05.036. - DOI - PubMed
-
- Danford C.J., Jiang Z.G., Salomaa V., Färkkilä M., Jula A., Männistö S., Lundqvist A., Valsta L., Perola M., Åberg F. Insulin Resistance and Genetic Risk Predict Liver-Related Outcomes and Death in Nonalcoholic Fatty Liver Disease. Hepatol. Commun. 2019;3(12):1704–1705. doi: 10.1002/hep4.1437. - DOI - PMC - PubMed
LinkOut - more resources
Full Text Sources