. 2025 May 13:12:1555705.
doi: 10.3389/fvets.2025.1555705. eCollection 2025.

Revealing gene expression links between milk fat globules and mammary glands in rodents via transcriptomics

Affiliations

Revealing gene expression links between milk fat globules and mammary glands in rodents via transcriptomics

Hancai Jiang et al. Front Vet Sci. .

Abstract

Currently, most studies on lactation-related traits and gene expression rely on invasive techniques to obtain mammary tissue. These methods are not only difficult to perform but also limit the availability of samples. Therefore, this study aimed to utilize whole transcriptome sequencing to investigate the gene expression profiles of Golden hamsters (Gh, n = 5) and Kunming mice (Km, n = 5). It compared the transcriptome expression between milk fat globules (MFG) and the mammary gland (MG), identified candidate genes and pathways associated with lactation traits, and assessed the potential of MFG as an effective alternative to MG. The data showed that a total of 21,360 genes were identified in the Gh group, with 66.5% of the mRNAs showing no differential expression between MG and MFG. In the Km group, a total of 44,248 genes were identified, with non-differentially expressed genes (NDEGs) accounting for 58.8%. Additionally, the majority of ncRNA data consisted of NDEGs. In both groups, approximately 80% of miRNA data were NDEGs. Notably, the proportion of NDEGs in circRNA data approached 100%. Enrichment analysis revealed that NDEGs from both groups were significantly enriched in several pathways, including the MAPK signaling pathway, PI3K-Akt signaling pathway, JAK-STAT signaling pathway, and prolactin signaling pathway, all of which are closely associated with lactation traits and the lactation process. Furthermore, we identified various ncRNAs that regulate the expression of target genes either directly or indirectly, thereby influencing the lactation process. This study validates MFG as a reliable substitute for MG, with potential applications in improving dairy science. By identifying key genes and pathways, it provides new insights for optimizing genetic selection and breeding strategies. It also supports the improvement of dairy animal management practices.

Keywords: gene expression profiles; lactation traits; mammary gland; milk fat globules; whole-transcriptome sequencing.


Conflict of interest statement

The authors declare that the research was conducted in the absence of any commercial or financial relationships that could be construed as a potential conflict of interest.

Figures
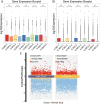
Figure 1
Figure 1
Basic information of transcriptome data. (A) Boxplot of expression level of each sample in Gh group (each point represents the expression level of an individual gene, and the boxes summarize the distribution within each sample). (B) Boxplot of expression level of each sample in Km group. (C) Volcano plots of Gh group and Km group (FDR <0.05 and |log2 (fold change)| ≥1).
Figure 2
Figure 2
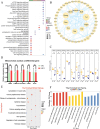
Expression patterns and functional analysis of mRNA in the Gh group. (A) KEGG and GO enrichment analysis of Gh NDEGs (each dot represents a pathway, with size correlating to the number of related genes and color intensity indicating the statistical significance). (B) The PPI network analysis of the Gh group (the more protein nodes, the larger the circle, the closer the connection with other genes, the thicker the link line) (C) Gh group gene expression boxplot in MG and MFG. ns indicates no significant difference (p > 0.05). (D) q-PCR validation of NDEGs in the Gh group. ns indicates no significant difference (p > 0.05). (E) KEGG enrichment analysis of DEGs in Gh group. (F) GO enrichment analysis of DEGs in the Gh group, categorized into biological processes (BP), cellular components (CC), and molecular functions (MF).
Figure 3
Figure 3
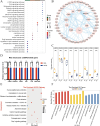
Expression patterns and functional analysis of mRNA in the Km group. (A) KEGG and GO enrichment analysis of Km NDEGs. (B) The PPI network analysis of the Km group. (C) Km group gene expression boxplot in MG and MFG. ns indicates no significant difference (p > 0.05). (D) q-PCR validation of NDEGs in the Km group. ns indicates no significant difference (p > 0.05). (E) KEGG enrichment analysis of DEGs in Km group. (F) GO enrichment analysis of DEGs in Km group.
Figure 4
Figure 4
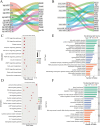
Bioinformatics analysis of lncRNA. (A) Statistics of the number of four different types of lncRNAs in the Gh group. (B) Statistics of the number of four different types of lncRNAs in the Km group. (C) Part of lncRNA transcripts and target gene Sankey diagram in Gh group. (D) Part of lncRNA transcripts and target gene Sankey diagram in Km group. (E) lncRNA KEGG and GO enrichment analysis in Gh group. (F) lncRNA KEGG and GO enrichment analysis in Km group.
Figure 5
Figure 5
Bioinformatics analysis of circRNA. (A) Part of circRNA transcripts and target gene Sankey diagram in Gh group. (B) Part of circRNA transcripts and target gene Sankey diagram in Km group. (C) KEGG and GO enrichment analysis of circRNAs in Gh group. (D) circRNA KEGG and GO enrichment analysis in Km group.
Figure 6
Figure 6
Bioinformatics analysis of miRNA. (A) Part of miRNA transcripts and target gene Sankey diagram in Gh group. (B) Part of miRNA transcripts and target gene Sankey diagram in Km group. (C) miRNA KEGG analysis of Gh group. (D) miRNA KEGG analysis of Km group. (E) miRNA GO enrichment analysis of Gh group. (F) miRNA GO enrichment analysis of Km group.

Similar articles

References

    1. Yi DY, Kim SY. Human breast milk composition and function in human health: from nutritional components to microbiome and microRNAs. Nutrients. (2021) 13:3094. doi: 10.3390/nu13093094, PMID: - DOI - PMC - PubMed
    1. Chen W, Gu X, Lv X, Cao X, Yuan Z, Wang S, et al. . Non-coding transcriptomic profiles in the sheep mammary gland during different lactation periods. Front Vet Sci. (2022) 9:983562. doi: 10.3389/fvets.2022.983562, PMID: - DOI - PMC - PubMed
    1. Ghulam Mohyuddin S, Liang Y, Xia Y, Wang M, Zhang H, Li M, et al. . Identification and classification of long non-coding RNAs in the mammary gland of the Holstein cow. Int J Mol Sci. (2023) 24:13585. doi: 10.3390/ijms241713585, PMID: - DOI - PMC - PubMed
    1. Cendron F, Franzoi M, De Marchi M, Rosani U, Penasa M. Characterization of circulating miRNA in cow milk and colostrum. J Dairy Sci. (2024) 108:2981–94. doi: 10.3168/jds.2024-25145, PMID: - DOI - PubMed
    1. Du C, Deng T, Zhou Y, Ye T, Zhou Z, Zhang S, et al. . Systematic analyses for candidate genes of milk production traits in water buffalo (Bubalus bubalis). Anim Genet. (2019) 50:207–16. doi: 10.1111/age.12739, PMID: - DOI - PubMed

LinkOut - more resources