. 2025 May 27;9(5):e70145.
doi: 10.1002/hem3.70145. eCollection 2025 May.

Characterization of cancer-associated fibroblasts and their spatial architecture reveals heterogeneity and survival associations in classic Hodgkin lymphoma

Affiliations

Characterization of cancer-associated fibroblasts and their spatial architecture reveals heterogeneity and survival associations in classic Hodgkin lymphoma

Suvi-Katri Leivonen et al. Hemasphere. .

Abstract

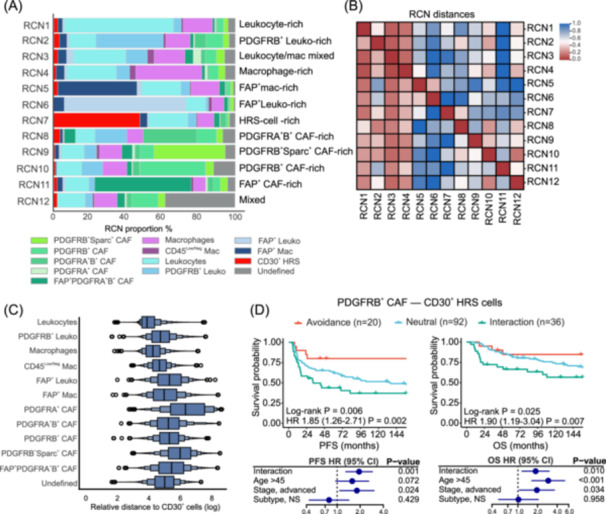
Cancer-associated fibroblasts (CAFs) are a heterogeneous population of stromal cells, which modulate the immune system and can have both pro- and anti-tumorigenic effects. In classic Hodgkin lymphoma (cHL), the role of CAFs has remained largely undefined. We applied multiplexed immunofluorescence imaging and spatial analysis on tumor samples from two independent cHL patient cohorts (n = 131 and n = 148) to study CAFs and their interactions with Hodgkin Reed-Sternberg (HRS) and tumor microenvironment (TME) cells at the single-cell resolution. We show that higher proportions of CAFs are associated with favorable outcomes, independent of the clinical covariables. In contrast, a subset of CD45+ immune cells with strong fibroblast-activation protein positivity, classified as macrophages, was less abundant in nodular sclerosis subtype and associated with worse outcomes. Neighborhood analysis allowed for the identification of colocalization or regional exclusion of phenotypically defined cell types and recurrent cellular neighborhoods. Despite the positive impact of CAF proportions on survival, patients with enrichment of platelet-derived growth factor receptor beta (PDGFRB)-positive CAFs in the vicinity of HRS cells had worse survival in both cohorts, independent of the clinical determinants. Our findings distinguish various subsets of CAFs and macrophages impacting survival in cHL and underscore the importance of the spatial arrangements in the TME.


Conflict of interest statement

S. L. declares the following competing financial interests: consultancy fees from AbbVie, Genmab, Gilead, Incyte, Novartis, Roche, and SOBI, all outside the submitted work; honoraria from Gilead, Incyte, Novartis, and SOBI; and research grants from Bayer, Celgene/BMS, Hutchmed, Genmab, Novartis, and Roche, all outside the submitted work. C. S. declares consultancy for Bayer and Eisai and research support from Epizyme and Trillium Therapeutics Inc, all outside the submitted work.

Figures

Figure 1
Figure 1
Proportions of CAF marker positive cells in the cHL TME. (A) Proportions of the CAF marker positive cells in cHL samples. (B) Correlation of the distinct CAF markers and CD31 as assessed by the Spearman's rank method. (C) Proportions of the CAF marker positive cells from the CD31+ cell fraction. (D) Association of distinct CAF marker positive cells on the progression‐free survival (PFS) as assessed by Cox univariable regression analysis with continuous variables.
Figure 2
Figure 2
Cell metacluster proportions in cHL TME. (A) Heatmap of median marker expression (z‐scaled) for the merged cell metaclusters. Cell number annotation on the left of the heatmap denotes the absolute number of cells in each metacluster. (B) t‐SNE plot of a random subset (10% from all cells) of cells colored by the cell metaclusters. (C) A stacked bar plot visualizing the distribution of the cell proportions of each metacluster in cHL patient samples. Violin plots showing the proportions of (D) CAFs, (E) CD30+ cells, and (F) macrophages in the NS sclerosis subtype versus the others. P values were determined by the Mann–Whitney test. (G) Violin plots showing the proportions of FAP+ macrophages in EBV‐positive versus EBV‐negative cases. P values were determined by the Mann–Whitney test.
Figure 3
Figure 3
Survival associations of CAFs and FAP + macrophages. Kaplan–Meier and forest plots demonstrating the impact of (A) FAP+ CAFs, (B) all CAFs, (C) and FAP+ macrophages on the progression‐free survival (PFS) of cHL patients. Categorization into high and low groups was done using the cut‐off determined by maximally selected rank statistics. Forest plots show the results of multivariable analyses with age, subtype, and stage.
Figure 4
Figure 4
Neighborhood analysis and cell–cell interactions. (A) Recurrent cellular neighborhoods (RCNs) identified in the cHL discovery cohort. The RCNs were named according to their dominant cell types. (B) A heatmap showing the average distances from cells in the RCN of interest (y‐axis) to cells in the other RCNs (x‐axis). (C) Average relative distances of each cell type to CD30+ HRS cells. (D) Representative mxIF images showing examples of a sample where PDGFRB+ CAFs interact/co‐localize with HRS cells and a sample where PDGFRB+ CAFs avoid HRS cells. Scale bar: 50 µm. (E) Kaplan–Meier plot visualizing the impact of the interactions between PDGFRB+ CAFs and CD30+ HRS cells on progression‐free survival (PFS) and overall survival (OS) in cHL. (F) Forest plot showing the results of a multivariable analysis of the interactions between PDGFRB+ CAFs and CD30+ HRS cells with age, subtype, and stage. Left panel: PFS; right panel: OS. Leuko, leukocyte; Mac, macrophage.
Figure 5
Figure 5
Cell metacluster proportions and survival associations in the validation cohort. (A) Heatmap of median marker expression (z‐scaled) for the cell metaclusters in the validation cohort. Cell number annotation on the left of the heatmap denotes the absolute number of cells in each metacluster. (B) A stacked bar plot visualizing the distribution of the cell metaclusters in the validation cohort. Violin plots showing cell metaclusters with differential proportions in the NS subtype versus the others (C) and in EBV‐positive versus EBV‐negative cases (D) in the validation cohort. P values were determined by the Mann–Whitney test. Kaplan–Meier and forest plots demonstrating the impact of (E) all CAFs, (F) FAP+ macrophages, and (G) FAP+ leukocytes on the overall survival (OS) of cHL patients. Categorization into high and low groups was done using the cut‐off determined by maximally selected rank statistics. Forest plots below the Kaplan–Meier plots show the results of multivariable analyses with age, subtype, and stage. Kaplan‐Meier and forest plots demonstrating the impact of (H) all CAFs, (I) FAP+ macrophages, (J) and FAP+ leukocytes on the progression‐free survival (PFS) of cHL patients. Categorization into high and low groups was done using the cut‐off determined by maximally selected rank statistics. Forest plots below the Kaplan–Meier plots show the results of multivariable analyses with age, subtype, and stage.
Figure 6
Figure 6
Validation of recurrent cellular neighborhoods and PDGFRB + CAF–HRS cell interactions. (A) Recurrent cellular neighborhoods (RCNs) identified in the cHL validation cohort. The RCNs were named according to their dominant cell types. (B) A heatmap showing the average distances from cells in the RCN of interest (y‐axis) to cells in the other RCNs (x‐axis). (C) Average relative distances of each cell type to CD30+ HRS cells. (D) Kaplan–Meier and forest plots visualizing the impact of the interactions between PDGFRB+ CAFs and CD30 + HRS cells on progression‐free survival (PFS) and overall survival (OS) in the validation cohort. Forest plots show the results of multivariable analyses of the interactions between PDGFRB+ CAFs and CD30+ HRS cells with age, subtype, and stage. Leuko, leukocyte; Mac, macrophage.

References

    1. Connors JM, Cozen W, Steidl C, et al. Hodgkin lymphoma. Nat Rev Dis Primers. 2020;6(1):61. 10.1038/s41572-020-0189-6 - DOI - PubMed
    1. Aldinucci D, Gloghini A, Pinto A, De Filippi R, Carbone A. The classical Hodgkin's lymphoma microenvironment and its role in promoting tumour growth and immune escape. J Pathol. 2010;221(3):248‐263. 10.1002/path.2711 - DOI - PubMed
    1. Veldman J, Visser L, Huberts‐Kregel M, et al. Rosetting T cells in Hodgkin lymphoma are activated by immunological synapse components HLA class II and CD58. Blood. 2020;136(21):2437‐2441. 10.1182/blood.2020005546 - DOI - PMC - PubMed
    1. Aoki T, Chong LC, Takata K, et al. Single‐cell transcriptome analysis reveals disease‐defining T‐cell subsets in the tumor microenvironment of classic hodgkin lymphoma. Cancer Discov. 2020;10(3):406‐421. 10.1158/2159-8290.CD-19-0680 - DOI - PubMed
    1. Aoki T, Chong LC, Takata K, et al. Single‐cell profiling reveals the importance of CXCL13/CXCR5 axis biology in lymphocyte‐rich classic Hodgkin lymphoma. Proc Natl Acad Sci. 2021;118(41):e2105822118. 10.1073/pnas.2105822118 - DOI - PMC - PubMed

LinkOut - more resources