. 2025 May 27;9(5):e70154.
doi: 10.1002/hem3.70154. eCollection 2025 May.

Oncogenomic profiling in infant-toddler T-ALL identifies NKX2 family genes as drivers linked to favorable outcomes

Affiliations

Oncogenomic profiling in infant-toddler T-ALL identifies NKX2 family genes as drivers linked to favorable outcomes

Manon Delafoy et al. Hemasphere. .

Abstract

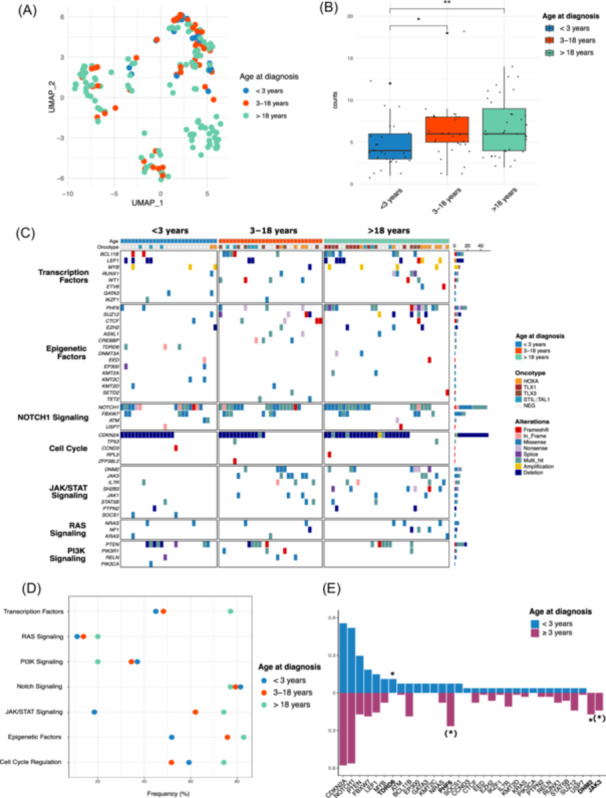
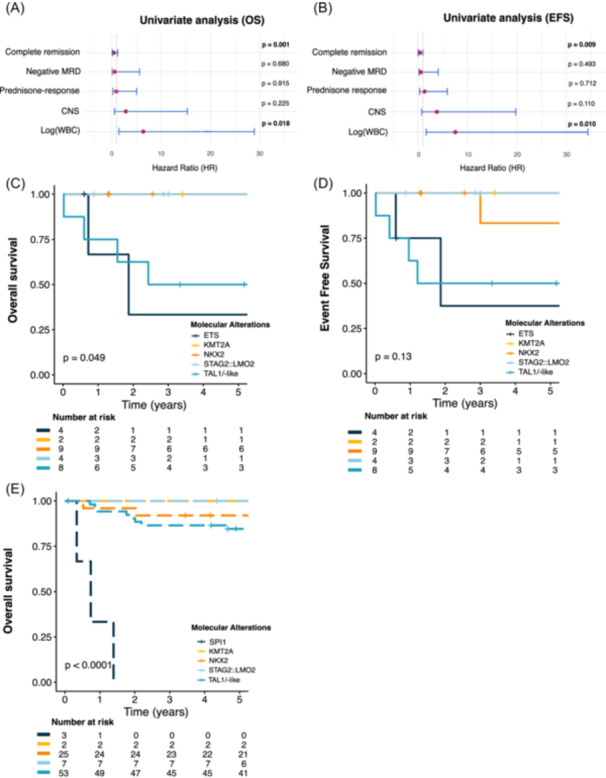
T-cell acute lymphoblastic leukemia (T-ALL) is a rare and aggressive hematological malignancy primarily affecting adolescents and young adults and is scarce in infants and toddlers under age 3. Unlike B-ALL, T-ALL in this young population remains poorly characterized due to limited data and lacks evidence-based guidelines to help clinicians determine the optimal treatment approach. In this study, we conducted a comprehensive genetic analysis of infant/toddler T-ALL cases from a French national cohort, utilizing high-throughput targeted sequencing, optical genome mapping, and RNA sequencing. Genetic analysis revealed the absence of TLX1/3 dysregulation. Instead, we identified a significant prevalence of NKX2 rearrangements (n = 9, 33%), co-occurring with MYB alterations (n = 5/9) or chromothripsis-like events (n = 3/9). Additional findings included TAL1/-like anomalies (30%), STAG2::LMO2 (15%), ETS rearrangements (15%), and rarely, KMT2A rearrangements (7%). Comparative analyses with 245 patients aged 3-18 years, enrolled in the pediatric FRALLE2000T French protocol, underscored the distinct clinical and genetic profiles of infants/toddlers. Despite presenting with higher rates of hyperleukocytosis and slower responses to treatment, they demonstrated comparable survival outcomes to older pediatric patients, with a 5-year overall survival (OS) rate of 75.4% (95% confidence interval [CI]: 60.0%-94.8%) versus 75.2% (95% CI: 69.8%-81.1%), p = 0.86. Notably, alterations in NKX2, KMT2A, and STAG2::LMO2 delineated oncogenic subgroups exhibiting a remarkable 100% OS rate, while patients with TAL1 or ETS dysregulation experienced less favorable outcomes. This was further supported by analyses of data from the COG AALL0434 trial, enhancing our understanding of T-ALL in infants/toddlers. Large-scale collaborative studies remain essential to confirm these findings and refine treatment strategies.


Conflict of interest statement

The authors declare no competing financial interests.

Figures

Figure 1
Figure 1
Survival outcomes of T‐ALL patients according to age at diagnosis. (A) Overall survival and (B) event‐free survival stratified by age at diagnosis. Blue curves represent infants/toddlers diagnosed with T‐ALL before age 3 (n = 27), while red curves represent patients diagnosed between ages 3 and 18 (n = 245).
Figure 2
Figure 2
Age‐dependent maturation block and oncogenic pathway alterations in T‐ALL patients. (A) UMAP scatterplot based on the 1000 most variable genes from VST‐normalized RNA‐seq data, illustrating the distribution of T‐ALL cases according to age at diagnosis. Each age group is color‐coded: blue for infants/toddlers (<3 years), red for patients aged 3–18 years, and green for adults (>18 years). (B) Bar plots illustrating the distribution of oncogenic alterations, including mutational events and DNA copy number variations, across different age groups at diagnosis. Statistical significance was evaluated using Fisher's exact test. (C) Oncoprint depicting the genetic anomalies identified in T‐ALL cases, stratified by age at diagnosis. Each case includes information on oncotype, with genes grouped by functional categories. The right panel presents the overall frequency of alterations per gene across the different age categories. (D) Comparative distribution of gene alterations by functional pathways in infant/toddler T‐ALL patients versus patients aged 3–18 years and adult cohorts. (E) Histogram depicting the alteration frequencies of the most altered genes in infant/toddler T‐ALL compared to older cohorts. Alterations not observed in infants/toddlers and with frequencies below 10% in patients aged ≥3 years are excluded from representation. Statistical significance was assessed using Fisher's exact test, with *p ≤ 0.05; (*) p = 0.05.
Figure 3
Figure 3
Oncogenomic landscape of infant/toddler T‐ALL unveiled by optical genome mapping (OGM). (A) Pie chart illustrating the distribution of genetic alteration families identified by OGM in infant/toddler T‐ALL (n = 27). (B) Sankey plot depicting genetic alterations newly identified in the infant/toddler T‐ALL cohort. Classical oncotype alterations detected via standard screening are shown on the left, while five distinct categories identified by OGM are shown on the right. “NA” indicates data not available. (C) Bar plots showing the frequencies of genetic alterations observed in infant/toddler T‐ALL (<3 years old, blue), with comparison to older cohorts (pediatric 3–18 years old in red and adult >18 years in green). *p ≤ 0.05 and ***p ≤ 0.001. (D) Heatmap of NKX2 family gene rearrangements identified by OGM in infant/toddler T‐ALL cases (n = 9), showing the distribution of alterations within this group. (E) Circos plot illustrating NKX2‐1 rearrangements in infant/toddler T‐ALL cases, with chromothripsis events highlighted (n = 3), mapping complex genomic structural changes associated with this subgroup. (F) MYB alterations are frequently observed in the NKX2 group, manifesting as either t(6;7) TRB::MYB rearrangements (up) or MYB duplications. The NKX2 group demonstrates upregulated MYB expression, as illustrated in the volcano plot (down), which compares RNA‐seq expression data between NKX2 and non‐NKX2 patients within the cohort. (G) Unsupervised clustering heatmap of the 1000 most variable genes in T‐ALL cases, revealing distinct molecular clusters driven by oncogene alterations, independent of patient age groups: infants/toddlers (<3 years, blue), pediatric (3–18 years, red), and adults (>18, green).
Figure 4
Figure 4
Clinical impact of molecular alterations encountered in infant/toddler T‐ALL. (A, B) Forest plot illustrating the univariate analysis of overall survival (OS) and event‐free survival (EFS) in infants and toddlers diagnosed with T‐ALL (n = 27). The red dots indicate the hazard ratios, while the blue bars represent the 95% confidence intervals for various clinical and biological variables. p < 0.05 are indicated in bold. White blood cell count at diagnosis (logWBC) was significantly associated with poorer OS (HR 6.3, 95% CI: 1.4–28.8, p = 0.018) and EFS (HR 7.5, 95% CI: 1.6–34.4, p = 0.01), while no significant associations were observed with central nervous system (CNS) involvement or negative molecular residual disease (MRD) at the end of induction. (C, D) Kaplan–Meier survival curves comparing OS (left) and EFS (right) based on specific molecular alterations identified within the infant/toddler T‐ALL cohort (n = 27). (E) Validation of OS outcomes based on molecular alterations in an independent cohort from the COG AALL0434 study, focused on patients under 3 years old (n = 90).

References

    1. Asnafi V, Beldjord K, Boulanger E, et al. Analysis of TCR, pTα, and RAG‐1 in T‐acute lymphoblastic leukemias improves understanding of early human T‐lymphoid lineage commitment. Blood. 2003;101:2693‐2703. - PubMed
    1. Clappier E, Cuccuini W, Kalota A, et al. The C‐MYB locus is involved in chromosomal translocation and genomic duplications in human T‐cell acute leukemia (T‐ALL), the translocation defining a new T‐ALL subtype in very young children. Blood. 2007;110:1251‐1261. - PubMed
    1. Inaba H, Mullighan CG. Pediatric acute lymphoblastic leukemia. Haematologica. 2020;105:2524‐2539. - PMC - PubMed
    1. Stutterheim J, de Lorenzo P, van der Sluis IM, et al. Minimal residual disease and outcome characteristics in infant KMT2A‐germline acute lymphoblastic leukaemia treated on the Interfant‐06 protocol. Eur J Cancer. 2022;160:72‐79. - PubMed
    1. Asnafi V, Beldjord K, Libura M, et al. Age‐related phenotypic and oncogenic differences in T‐cell acute lymphoblastic leukemias may reflect thymic atrophy. Blood. 2004;104:4173‐4180. - PubMed

LinkOut - more resources