. 2025 May 22:19:4275-4295.
doi: 10.2147/DDDT.S517114. eCollection 2025.

Olive Oil Solution of Volatile Oil from Citri Reticulatae Pericarpium Viride Alleviates Slow-Transit Constipation via Regulating SCF/c-Kit Signaling Pathway and Intestinal Flora

Affiliations

Olive Oil Solution of Volatile Oil from Citri Reticulatae Pericarpium Viride Alleviates Slow-Transit Constipation via Regulating SCF/c-Kit Signaling Pathway and Intestinal Flora

Shuting Zou et al. Drug Des Devel Ther. .

Abstract

Objective: The aroma of the aromatic class of traditional Chinese medicines can promote gastrointestinal peristalsis. This study aimed to explore the mechanisms by which volatile oil from Citri Reticulatae Pericarpium Viride (VOCRPV) alleviates slow-transit constipation (STC).

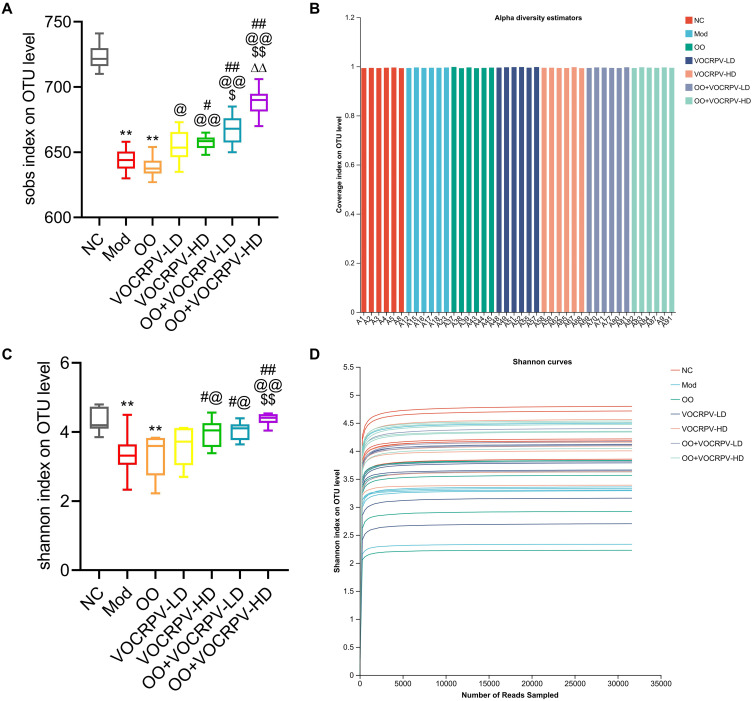
Methods: The main active ingredients in VOCRPV were determined by High-Performance Liquid Chromatography (HPLC). Due to poor stability, an olive oil solution was prepared to enhance the volatile oil's stability. A mouse model of STC was induced using loperamide hydrochloride. The mice's body weight was monitored weekly. The number of fecal pellets, fecal water content, and small intestinal propulsion rate were detected. The colon tissues were analyzed using HE staining. The serum content of gastrointestinal hormones was measured using the corresponding ELISA kit. The protein expressions of stem cell factor (SCF) and c-Kit in colon tissues were detected by Western blot and immunohistochemistry methods. The 16S rRNA gene sequencing was used to detect the intestinal flora.

Results: The contents of p-isopropyl toluene, γ-Terpinene, and d-Limonene were determined by HPLC. VOCRPV and its olive oil solution significantly enhanced body weight, increased the number of fecal pellets, improved fecal water content, and boosted small intestinal propulsion rate in mice with loperamide-induced STC, while also repairing colon mucosa damage. They also increased gastrin (Gas) and motilin (MTL) levels in treated mice, upregulated the expression of SCF and c-Kit proteins, and restored intestinal flora balance in STC mice.

Conclusion: VOCRPV could effectively alleviate STC, and olive oil enhances its therapeutic effect. VOCRPV alleviates STC by elevating Gas and MTL levels, activating the SCF/c-Kit signaling pathway, and modulating intestinal flora.

Keywords: intestinal flora; olive oil; slow-transit constipation; stem cell factor/c-Kit signaling pathway; volatile oil from Citri Reticulatae Pericarpium Viride.


Conflict of interest statement

The authors declare no conflicts of interest in this work.

Figures

None
Graphical abstract
Figure 1
Figure 1
HPLC Chromatogram of the mixed reference solution and the sample solution. (A) The HPLC Chromatogram of the mixed reference solution. (B) The HPLC Chromatogram of the sample solution. 1. p-isopropyl toluene, 2. γ-Terpinene, 3. d-Limonene.
Figure 2
Figure 2
Effects of VOCRPV and its olive oil solution on relevant indicators in STC mice. Body weight (A), number of fecal pellets (B), fecal water content (C), and small intestinal propulsion rate (D) in the NC and Mod groups after the end of modeling. (E) Body weight during modeling and treatment. Number of fecal pellets (F), fecal water content (G), and small intestinal propulsion rate (H) after the end of treatment. Data are expressed as mean ± SD (n = 8). Each repeat was performed as a separate, independent experiment or observation. **P < 0.01, vs NC group; #P < 0.05, ##P < 0.01, vs Mod group; &P < 0.05, &&P < 0.01, vs Mos group; @P < 0.05, @@P < 0.01, vs OO group; $P < 0.05, $$P < 0.01, vs VOCRPV-LD group; ΔP < 0.05, ΔΔP < 0.01, vs VOCRPV-HD group.
Figure 3
Figure 3
Effects of VOCRPV and its olive oil solution on pathological histomorphological changes of colon in STC mice (×200).
Figure 4
Figure 4
Effects of VOCRPV and its olive oil solution on serum gastrointestinal hormone levels in STC mice. (A) Serum Gas level. (B) Serum MTL level. Data are expressed as mean ± SD (n = 5). Each repeat was performed as a separate, independent experiment or observation. **P < 0.01, vs NC group; #P < 0.05, ##P < 0.01, vs Mod group; &&P < 0.01, vs Mos group; @P < 0.05, @@P < 0.01, vs OO group; $$P < 0.01, vs VOCRPV-LD group; ΔΔP < 0.01, vs VOCRPV-HD group.
Figure 5
Figure 5
Western blot detection of SCF and c-Kit protein expression in the colon tissues of mice. (A) Detection of SCF and c-Kit protein expression by Western blot. (B) Quantitative analysis of SCF protein expression. (C) Quantitative analysis of c-Kit protein expression. Data are expressed as mean ± SD (n = 3). Each repeat was performed as a separate, independent experiment or observation. **P < 0.01, vs NC group; #P < 0.05, ##P < 0.01, vs Mod group; @P < 0.05, @@P < 0.01, vs OO group; $$P < 0.01, vs VOCRPV-LD group; ΔΔP < 0.01, vs VOCRPV-HD group.
Figure 6
Figure 6
Immunohistochemistry detection of SCF and c-Kit expression in the colon tissues of mice. (A) The level of SCF protein detected by immunohistochemistry analysis (×400). (B) Quantitative analysis of SCF protein. (C) Quantitative analysis of c-Kit protein. (D) The level of c-Kit protein detected by immunohistochemistry analysis (×400). Data are expressed as mean ± SD (n = 5). Each repeat was performed as a separate, independent experiment or observation. **P < 0.01, vs NC group; #P < 0.05, ##P < 0.01, vs Mod group; @P < 0.05, @@P < 0.01, vs OO group; $P < 0.05, vs VOCRPV-LD group.
Figure 7
Figure 7
Effects of VOCRPV and its olive oil solution on alpha diversity in STC mice. (A) The Sobs index. (B) The coverage index. (C) The Shannon index. (D) Shannon curves. Data are expressed as mean ± SD (n = 6). Each repeat was performed as a separate, independent experiment or observation. **P < 0.01, vs NC group; #P < 0.05, ##P < 0.01, vs Mod group; @P < 0.05, @@P < 0.01, vs OO group; $P < 0.05, $$P < 0.01, vs VOCRPV-LD group; ΔΔP < 0.01, vs VOCRPV-HD group.
Figure 8
Figure 8
Effects of VOCRPV and its olive oil solution on beta diversity in STC mice. (A) PCoA analysis. (B) NMDS analysis.
Figure 9
Figure 9
Venn diagram and community composition on the phylum Level. (A) Venn diagram. (B) Community barplot analysis on the phylum level. (C) Relative abundance of Firmicutes. (D) Relative abundance of Bacteroidota. Data are expressed as mean ± SD (n = 6). Each repeat was performed as a separate, independent experiment or observation. **P < 0.01, vs NC group; ##P < 0.01, vs Mod group; @P < 0.05, @@P < 0.01, vs OO group; $P < 0.05, $$P < 0.01, vs VOCRPV-LD group; ΔΔP < 0.01, vs VOCRPV-HD group.
Figure 10
Figure 10
The community barplot analysis and heatmap analysis on the genus Level. (A) Community barplot analysis. (B) Community heatmap analysis.
Figure 11
Figure 11
Effects of VOCRPV and its olive oil solution on the specific intestinal microbiota abundances on the genus level. (A) Relative abundance of Alloprevotella. (B) Relative abundance of Lactobacillus. (C) Relative abundance of unclassified_f__Lachnospiraceae. (D) Relative abundance of Parabacteroides. (E) Relative abundance of Bacteroides. (F) Relative abundance of Lachnospiraceae_NK4A136_group. Data are expressed as mean ± SD (n = 6). Each repeat was performed as a separate, independent experiment or observation. *P < 0.05, **P < 0.01, vs NC group; #P < 0.05, ##P < 0.01, vs Mod group; @P < 0.05, @@P < 0.01, vs OO group; $P < 0.05, $$P < 0.01, vs VOCRPV-LD group; ΔΔP < 0.01, vs VOCRPV-HD group.

Similar articles

References

    1. Van Mill M, Koppen I, Benninga M. Controversies in the management of functional constipation in children. Curr Gastroenterol Rep. 2019;21:1–8. doi:10.1007/s11894-019-0690-9 - DOI - PubMed
    1. Shin JE, Park KS, Nam K. Chronic functional constipation. Korean J Gastroenterol. 2019;73(2):92–98. doi:10.4166/kjg.2019.73.2.92 - DOI - PubMed
    1. Barberio B, Judge C, Savarino EV, Ford AC. Global prevalence of functional constipation according to the Rome criteria: a systematic review and meta-analysis. Lancet Gastroenterol Hepatol. 2021;6(8):638–648. doi:10.1016/s2468-1253(21)00111-4 - DOI - PubMed
    1. Tanner S, Chaudhry A, Goraya N, et al. Prevalence and clinical characteristics of dyssynergic defecation and slow transit constipation in patients with chronic constipation. J Clin Med. 2021;10(9):2027. doi:10.3390/jcm10092027 - DOI - PMC - PubMed
    1. Bharucha AE, Lacy BE. Mechanisms, evaluation, and management of chronic constipation. Gastroenterology. 2020;158(5):1232–1249.e3. doi:10.1053/j.gastro.2019.12.034 - DOI - PMC - PubMed

MeSH terms

LinkOut - more resources