

Impact of prior exposures on biomarkers of blast during military tactical training
- PMID: 40433620
- PMCID: PMC12106048
- DOI: 10.3389/fneur.2025.1589742
Impact of prior exposures on biomarkers of blast during military tactical training
Abstract
Introduction: Blast injuries and subclinical effects are of significant concern among those Service Members (SMs) participating in military operations and tactical trainings. Studies of SMs repeatedly exposed during training find concussion-like symptomology with transient decrements in neurocognitive performance, and alterations in blood biomarkers. How prior mild TBI (mTBI) history interacts with low-level blast (LLB) exposure, however, remains unexplored, which we investigate in the present study, to identify interindividual biomarker changes from LLB exposures influenced by prior history of mTBI.
Methods: Gene transcript and amyloid-beta (Aβ40 and Aβ42) protein levels were assayed using timeseries blood specimens collected at pre-blast, post-blast (within ~1 h), and follow-up-blast (~16 h) after LLB exposure for 30 SMs (age 30.3 ± 7.5) via RNA-seq and Single Molecule Array (SIMOA). Statistical models with timepoint and mTBI status interaction adjusted for age were used, and p-values adjusted for multiple testing.
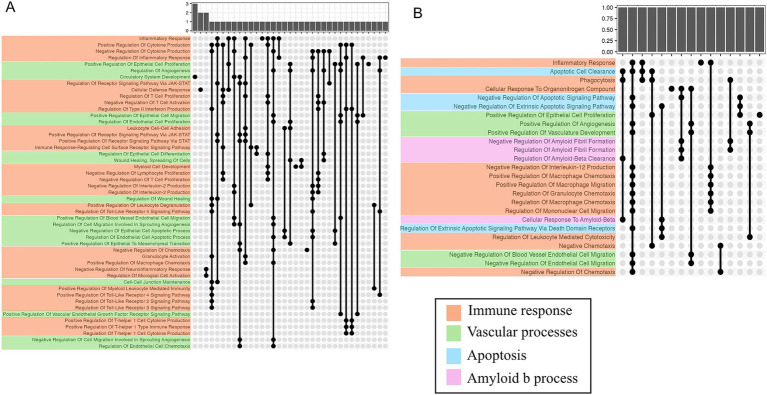
Results: We found enrichment of genes involved in blood brain barrier, inflammatory, and immune responses associated with blast exposure, with significant elevated expression of target genes among SMs with mTBI history. Levels of Aβ40 and Aβ42 did not differ pre-blast vs. post/follow-up-blast LLB exposure when comparing SMs by prior mTBI history. Aβ40 and Aβ42 levels were significantly decreased in response to blast at the follow-up (~16 h) LLB exposure timepoint, concomitant with elevated expression of genes involved in amyloid-beta regulation and clearance in SMs with mTBI.
Conclusion: Findings show inter-individual differences in biomarker levels following exposures to blast that may be attributed to prior mTBI history.
Keywords: amyloid beta; biomarker; blast overpressure; breacher; gene expression; mTBI.
Copyright © 2025 Wang, Sun, Liu, Kranfli, Nemes, Sullan, Hoisington, Brenner, Skotak, LaValle, Ge, Carr and Haghighi.
Conflict of interest statement
The authors declare that the research was conducted in the absence of any commercial or financial relationships that could be construed as a potential conflict of interest.
Figures


Similar articles
-
Association of Blast Exposure in Military Breaching with Intestinal Permeability Blood Biomarkers Associated with Leaky Gut.Int J Mol Sci. 2024 Mar 21;25(6):3549. doi: 10.3390/ijms25063549. Int J Mol Sci. 2024. PMID: 38542520 Free PMC article.
-
CSF β-Amyloid and Tau Biomarker Changes in Veterans With Mild Traumatic Brain Injury.Neurology. 2024 Apr 9;102(7):e209197. doi: 10.1212/WNL.0000000000209197. Epub 2024 Mar 13. Neurology. 2024. PMID: 38478804
-
Self-Reported Concussion Symptomology during Deployment: Differences as a Function of Injury Mechanism and Low-Level Blast Exposure.J Neurotrauma. 2020 Oct 15;37(20):2219-2226. doi: 10.1089/neu.2020.6997. Epub 2020 Jun 18. J Neurotrauma. 2020. PMID: 32368945
-
Potential Health and Performance Effects of High-Level and Low-Level Blast: A Scoping Review of Two Decades of Research.Front Neurol. 2021 Mar 10;12:628782. doi: 10.3389/fneur.2021.628782. eCollection 2021. Front Neurol. 2021. PMID: 33776888 Free PMC article.
-
Combat TBI: History, Epidemiology, and Injury Modes.In: Kobeissy FH, editor. Brain Neurotrauma: Molecular, Neuropsychological, and Rehabilitation Aspects. Boca Raton (FL): CRC Press/Taylor & Francis; 2015. Chapter 2. In: Kobeissy FH, editor. Brain Neurotrauma: Molecular, Neuropsychological, and Rehabilitation Aspects. Boca Raton (FL): CRC Press/Taylor & Francis; 2015. Chapter 2. PMID: 26269923 Free Books & Documents. Review.
References
LinkOut - more resources
Full Text Sources
Research Materials