. 2025 Jul 28;64(31):e202507348.
doi: 10.1002/anie.202507348. Epub 2025 Jun 2.

Protein Secondary Structure Patterns in Short-Range Cross-Link Atlas

Affiliations

Protein Secondary Structure Patterns in Short-Range Cross-Link Atlas

Alice Vetrano et al. Angew Chem Int Ed Engl. .

Abstract

Cross-linking mass spectrometry (XL-MS) has become a powerful tool in structural biology for investigating protein structure, dynamics, and interactomics. However, short-range cross-links, defined as those connecting residues fewer than 20 positions apart, have traditionally been considered less informative and largely overlooked, leaving significant data unexplored in a systematic manner. Here, we present a system-wide analysis of short-range cross-links, demonstrating their intrinsic correlation with protein secondary structure. We introduce the X-SPAN (Cross-link Structural Pattern Analyzer) software, which integrates publicly available XL-MS datasets from system-wide experiments with AlphaFold-predicted protein structures. Our analysis reveals distinct cross-linking patterns that reflect the spatial constraints imposed by secondary structural elements. Specifically, α-helices exhibit periodic cross-linking patterns consistent with their characteristic helical pitch, whereas coils and β-strands display nearly monotonic distributions. A context-dependent protein grammar reinforces short-range cross-link specificity. Short-range cross-links can enhance the statistical inference of secondary structures within integrative modeling workflows. Additionally, our work establishes a framework for benchmarking AlphaFold's local prediction accuracy and provides novel quality control criteria for XL-MS experiments. We anticipate that X-SPAN and our short-range cross-link database will serve as a valuable resource for exploring local secondary structure rearrangements and their potential roles in protein function and allosteric regulation.

Keywords: Chemical proteomics; Cross‐linking; Mass spectrometry; Structural biology; Structural proteomics.


Conflict of interest statement

The authors declare no conflict of interest.

Figures
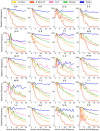
Figure 1
Figure 1
Relative frequency of pairwise amino acid distances across the human proteome. Each plot corresponds to an amino acid pair (e.g., K‐K for lysine). The x‐axis represents the amino acid spacing, while the y‐axis represents the relative frequency normalized within each structural category. Curves are color‐coded by secondary structure: α‐helix (yellow), β‐strand (red), coil (pink), mixed elements (green), and whole proteome (blue). Charged residues are plotted in the first row followed by polar and hydrophobic residues.
Figure 2
Figure 2
Relative frequency of K─K cross‐links at increasing amino acid spacing. The x‐axis represents the distance between amino acid pairs. The y‐axis reports both the relative frequency of cross‐links (left), normalized within each structural category to a maximum of 100, and the absolute counts (right). The four classes of structural elements are presented in separate columns and are color coded as follows: α‐helix–yellow lines, β‐strand–red lines, coil–pink lines, mixed elements–green lines, and total–blue lines. Distributions from cross‐linkers with similar spacer length are presented in separate lines. Cumulative data are presented in the bottom row. In addition to the 1% false discovery rate (FDR) associated to each dataset, the shaded areas around the cumulative curves in the bottom panels represent the standard error, estimated by dividing the cumulative dataset into three equal random subsets. Additionally, the bottom panels display the relative frequency of pairwise amino acid distances across the human proteome for comparison. Cross‐link redundancy has been removed within each dataset.
Figure 3
Figure 3
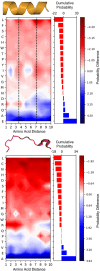
Influence of neighboring amino acids on lysine cross‐linking propensity within α‐helices (upper panel) and coils (bottom panel). Each heatmap represents the percentage difference in amino acid composition surrounding cross‐linked lysine compared to the background proteome. The y‐axis lists amino acids, while the x‐axis indicates their sequence distance from a cross‐linked lysine. Amino acids are ranked based on their overall effect on lysine cross‐linking, with red indicating cross‐linking inhibition and blue indicating cross‐linking promotion. The right‐side histogram illustrates this cumulative effect across all positions. Dashed lines mark the helical pitch, highlighting periodic cross‐linking patterns in α‐helices.
Figure 4
Figure 4
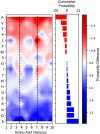
Influence of neighboring amino acids on cross‐linked α‐helix to coil recognition. The heatmap represents the percentage difference in amino acid composition between α‐helices and coils. The y‐axis lists amino acids, while the x‐axis indicates their sequence distance from a cross‐linked lysine. Amino acids are ranked based on their diagnostic capability, with red indicating residues more abundant in coils and blue indicating residues enriched in α‐helices. The right‐side histogram illustrates this cumulative effect across all positions. Dashed lines mark the helical pitch, highlighting periodic cross‐linking patterns in α‐helices.
Figure 5
Figure 5
Distribution of K─K cross‐links at different pLDDT scores. The x‐axis represents the distance between amino acid pairs. The y‐axis reports the relative frequency of cross‐links, normalized within each structural category to a maximum of 100. The four classes of structural elements are presented in separate columns and are color coded as follows: α‐helix–yellow lines, β‐strand–red lines, coil–pink lines, and mixed elements–green lines. Distributions from cross‐linkers with similar spacer length are presented in separate lines. Cumulative data are presented in the bottom row. In addition to the 1% false discovery rate (FDR) associated to each dataset, the shaded areas around the cumulative curves in the bottom panels represent the standard error, estimated by dividing the cumulative dataset into three equal random subsets. pLDDT score ranges are presented as dotted line (0–60), dashed line (60–80), and solid line (80–100). Cross‐link redundancy has been removed within each dataset.
Figure 6
Figure 6
Distribution of DSSI cross‐links at different FDR. The x‐axis represents the distance between amino acid pairs. The y‐axis reports the relative frequency of cross‐links (left), normalized within each structural category to a maximum of 100. The four classes of structural elements are color coded as follows: α‐helix–yellow lines, β‐strand–red lines, coil–pink lines, and mixed elements–green lines. Different FDR thresholds are represented as dotted (10%), dashed (5%), and solid (1%) lines. The shaded areas around the cumulative curves represent the standard error, estimated by dividing the cumulative dataset into three equal random subsets. Cross‐link redundancy has been removed within each dataset.

References

    1. O'Reilly F. J., Rappsilber J., Nat. Struct. Mol. Biol. 2018, 25, 1000–1008. - PubMed
    1. Graziadei A., Rappsilber J., Structure 2022, 30, 37–54. - PubMed
    1. Botticelli L., Bakhtina A. A., Kaiser N. K., Keller A., McNutt S., Bruce J. E., Chu F., Curr. Opin. Struct. Biol. 2024, 87, 102872. - PMC - PubMed
    1. Yu C., Huang L., Curr. Opin. Chem. Biol. 2023, 76, 102357. - PMC - PubMed
    1. Klykov M. K. O., Carragher B., Heck A. J. R., Noble A. J., Scheltema R. A., Mol. Cell 2022, 82, 285–303. - PMC - PubMed

LinkOut - more resources