. 2025 Aug;12(30):e03173.
doi: 10.1002/advs.202503173. Epub 2025 May 28.

A Human Engineered Heart Tissue-Derived Lipotoxic Diabetic Cardiomyopathy Model Revealed Early Benefits of Empagliflozin

Affiliations

A Human Engineered Heart Tissue-Derived Lipotoxic Diabetic Cardiomyopathy Model Revealed Early Benefits of Empagliflozin

Lin Cai et al. Adv Sci (Weinh). 2025 Aug.

Abstract

Diabetic cardiomyopathy (DbCM) is increasingly prevalent, but intervention targets remain unclear due to the lack of appropriate models and the complexity of risk factors. Here, this work establishes an in vitro assessment system for DbCM function using cardiomyocytes derived from human pluripotent stem cells and engineered heart tissue. This work finds high-fat status in complex diabetes risk factors majorly contributes most to cardiomyocyte death and contractile dysfunction. Notably, PA induced early electrophysiological abnormalities, and lately is associated with cardiac fibrosis, mitochondrial fission, and systolic and diastolic dysfunction at tissue level. Using this in vitro assessment system, this work finds that empagliflozin (EMPA), a first-line glucose-lowering drug, effectively alleviated early PA-induced cardiomyocyte injury. Treatment with EMPA enhanced abnormal diastolic and electrophysiological functions in the PA-hEHT model and significantly reduced endoplasmic reticulum stress, and apoptosis. Furthermore, these promising results are confirmed in a type 2 diabetes mellitus mouse model, reinforcing the potential of EMPA as a therapeutic option to alleviate cardiomyocyte injury under diabetic conditions. These findings suggest that this work has developed an engineered model of diabetic cardiomyopathy that mimics the various stages of lipotoxic myocardial injury and support the use of EMPA as a potential therapeutic option for diabetic or lipotoxic cardiomyopathy.

Keywords: diabetic cardiomyopathy; diastolic dysfunction; empagliflozin; hEHT; in vitro model.


Conflict of interest statement

The authors declare no conflict of interest.

Figures
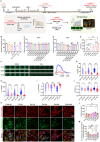
Figure 1
Figure 1
Palmitate acid represents a key diabetogenic risk factor that induces injury in iPSC‐CM. A) Scheme for evaluating the effects of diabetes risk factors on iPSC‐CMs. B–D) CCK8 assay showing survival of iPSC‐CM treated‐with high glucose (Glu), palmitic acid (PA), endothelin‐1(ET‐1) and cortisol (C) alone or in combination (B), or different concentrations of Glu or PA for 24 h (C) and 72 h (D) (n = 5). E) Lactate dehydrogenase (LDH) release from iPSC‐CM with PA treatment for the indicated time points. (n = 3). F–J) Representative images (F) and quantification (G) of Ca2+ transient in PA‐treated iPSC‐CMs for 24 h/48 h/72 h and the indicated control. iPSC‐CMs were loaded with Fluo‐4 AM and paced at 1 Hz, amplitude (H), maximum upstroke velocity (I), and duration at 50% repolarization (CaTD50) (J) were analyzed. K–M) Representative confocal images (K) and quantitative analysis of live Mito‐Tracker (L) and ER‐Tracker (M) staining in reseeded iPSC‐CMs at the indicated time points. (n = 8 images per group). ns p > 0.05, * p < 0.05, ** p < 0.01, *** p < 0.001, ## p < 0.01 versus PA group in (B).
Figure 2
Figure 2
PA‐induced hEHT models of early diabetic cardiomyopathy injury. A) Scheme for evaluating the early and late effects of PA on hEHT. B) Physical image of hEHT on day 7. Scale bar = 1 mm. C–F) Schematic diagram (C) and statistical analysis of characteristic peaks, including active contractile force (D), passive contractile force (E), and the number of diastolic dysfunction peaks (F) under different stretching conditions of hEHT during progressive stretching with electrical stimulation (1.5 Hz) after 24 h of treatment in PA stimulation (n = 7 per group). G) Immunofluorescence staining images (left) and quantification (right) of the percentage of Vimentin+ cells in the hEHTs at 24 h post‐PA treatment. Scale bar = 100 µm. H) Lactate dehydrogenase (LDH) release from hEHTs following 24 h of PA treatment. (n = 4). I,J) Transmission electron microscopy (TEM) images showing the morphology of mitochondria and sarcomeres in hEHTs from both the PA and control groups (I), along with quantitative analysis of total mitochondrial area, individual mitochondrial area, and mitochondrial roundness (J). Scale bar = 500 nm. K–P) Optical mapping of hEHTs in the PA and control groups at 24 h, stimulated at a pacing frequency of 1 Hz. The results included isochronal activation and propagation direction maps alongside calcium transient traces (K), as well as statistical analysis of Ca2⁺ fluorescence signal conduction velocity (L), amplitude (M), maximum downstroke velocity (N), propagation direction dispersion (O), and the frequency distribution of two different types of diastolic dysfunction occurrences (P). n = 8 for the control group, n = 7 for the PA group. ns p > 0.05, * p < 0.05, ** p < 0.01, *** p < 0.001, **** p < 0.0001.
Figure 3
Figure 3
PA‐induced hEHT models of later diabetic cardiomyopathy injury. A–F) Schematic diagram (A) and statistical analysis of characteristic peaks, including active contractile force (B), passive contractile force (C), maximum contraction velocity (D), maximum relaxation velocity (E), and the number of diastolic dysfunction peaks (F) under different stretching conditions of hEHT during progressive stretching with electrical stimulation (1.5 Hz) after 72 h of treatment in PA stimulation (n = 7 per group). G) Lactate dehydrogenase (LDH) release from hEHTs following 72 h of PA treatment. (n = 3). H) Immunofluorescence staining images (left) and quantification (right) of the percentage of Vimentin+ cells in the hEHTs at 72 h post‐PA treatment. Scale bar = 100 µm. I) Representative TEM images and quantitative analysis of mitochondrial numbers in both groups. Scale bar = 500 nm. J–M) Optical mapping of hEHTs in the PA and control groups at 72 h, stimulated at a pacing frequency of 1 Hz. The results included isochronal activation and propagation direction maps alongside calcium transient traces (J), as well as statistical analysis of Ca2⁺ fluorescence signal conduction velocity (K), amplitude (L), and the frequency distribution of two different types of diastolic dysfunction occurrences (M). n = 8 for each group. * p < 0.05, ** p < 0.01, *** p < 0.001, **** p < 0.0001.
Figure 4
Figure 4
Signaling pathways related to DCM in PA‐induced hEHT models. A) Principal component analysis of the global gene expression profiles between CON1d and PA1d as revealed by RNA‐seq. B–G) Kyoto Encyclopedia of Genes and Genomes (KEGG) pathway enrichment analysis was performed on up‐regulated genes and down‐regulated genes (p‐value < 0.05), and the top 10 KEGG pathways were listed with their p‐values and counts (B). Heatmaps showing the upregulation of pathways related to insulin resistance (C), fatty acid metabolism (D), and calcium signaling (E), as well as the downregulation of pathways related to oxidative phosphorylation (F) and mitochondrial translation (G) in the PA1d group compared to the CON1d group. H) Principal component analysis of global gene expression profiles between CON3d and PA3d. I–K) KEGG pathway enrichment analysis showed the top 10 pathways with upregulated and downregulated genes, along with their p‐values and counts (I). Heatmaps indicated that the TNF signaling pathway (J) was upregulated, while cardiac muscle contraction (K) was downregulated in the PA3d group. L) GSEA showed enrichment of the unfolded protein response and apoptosis pathways in the PA3d group. M) The top 10 biological process terms identified through Gene Ontology enrichment analysis were listed. N–P) Heatmaps displayed the DEGs in BP terms, including upregulation of apoptotic process (N), protein processing in endoplasmic reticulum (O), and downregulation of sarcomere organization (P), mitochondrial ATP synthesis coupled proton transport (Q) in the PA3d group compared with CON3d.
Figure 5
Figure 5
Protective Role of Empagliflozin against PA‐Induced Injury in iPSC‐CMs and hEHTs. A,B) CCK8 (A, n = 5) and LDH (B, n = 5) assays of iPSC‐CM treated‐with PA, PA + empagliflozin (EMPA) and control for 24 h and 48 h. C–H) Representative images (C) and quantification of Ca2+ transient in iPSC‐CMs from PA, PA+EMPA and control group after 24 h. iPSC‐CMs were loaded with Fluo‐4 AM and paced at 1 Hz, the parameters including amplitude (D), maximum upstroke velocity (E), maximum release velocity (F), the duration at 50% and 80% repolarization (CaTD50/CaTD80) (G,H) were analyzed. I,K) Statistical analysis of contraction force, including active contractile force (I), maximum relaxation velocity (J), and heatmaps showing the percentage of diastolic dysfunction peaks (K) after 24 h of treatment in PA, PA+EMPA and control group. n = 6 per group. L–P) Optical mapping of hEHTs in the PA, PA+EMPA and control groups at 24 h, stimulated at a pacing frequency of 1 Hz. The results included isochronal activation and propagation direction maps alongside calcium transient traces (L), as well as statistical analysis of Ca2⁺ fluorescence signal conduction velocity (M), amplitude (N), maximum upstroke velocity (O), and the frequency distribution of two different types of diastolic dysfunction occurrences (P). n = 9 for the CON group, n = 9 for the PA group, n = 8 for the PA+EMPA group. ns p > 0.05, * p < 0.05, ** p < 0.01, *** p < 0.001.
Figure 6
Figure 6
Empagliflozin Protects hEHT and iPSC‐Derived Cardiomyocytes from Palmitate‐Induced Injury by Inhibiting Mitochondrial Dysfunction, Apoptosis, and ER Stress. A) Principal component analysis of global gene expression profiles between PA24h and PA+EMPA24h. B,C) KEGG pathway enrichment analysis showed the top 10 pathways with upregulated and downregulated genes, along with their p‐values and counts (B). Heatmaps showing the upregulation of pathways related to cardiac muscle contraction in the PA+EMPA group compared to the PA group (C). D) Representative fluorescent image (left) and quantification (right) of mitochondrial membrane potential measure by JC‐1 staining in iPSC‐CMs. Red fluorescence indicates the mitochondrial JC‐1 aggregate JC‐1, while green fluorescence represents the monomeric form of JC‐1. Bars = 50 µm. E) GSEA showed enrichment of apoptosis and unfolded protein response pathways in the PA group. F) The top 10 biological process terms identified through Gene Ontology enrichment analysis were listed. G–I) Heatmaps displayed the DEGs in BP terms, including downregulation of apoptotic process (G) and ER stress (H‐I) in the PA+EMPA group compared with the PA group. J) Representative fluorescent images (left) and quantification (right) of apoptotic cardiomyocyte rates in iPSC‐CMs were assessed by TUNEL assay in the CON, PA, and PA+EMPA groups at 24 h. Bars = 50 µm. K‐L) Immunoblotting analyses of GRP78 and CHOP protein levels in hEHTs treated with CON, PA, or PA+EMPA for 24 h. β‐Actin was used as a loading control. n = 3 biological replicates. ns p > 0.05, *p < 0.05, **p < 0.01, ***p < 0.001.
Figure 7
Figure 7
Empagliflozin protects against cardiac injury in T2DM mice. A) Schematic protocol of T2DM induction and EMPA administration in C57/BL6 mice. B–H) Representative images of echocardiography (B, E) and quantification of parameters including left ventricular ejection fraction (LVEF, C) and left ventricular Fractional shortening (LVFS, D), Mitral Valve Velocity E/A Ratio (F), e“/a” Ratio (G) and E/a' Ratio (H) from the NC + vehicle group (n = 6), the HFD + Vehicle group (n = 7), and the HFD + Empagliflozin group (n = 7). I,J) Representative TEM images (I) and quantitative analysis of mitochondrial roundedness (J) from each group. Yellow arrows indicated lipid droplets, orange circles indicated mild mitochondrial damage, and the red circles represented severe mitochondrial damage. K) The area of lipid droplets was quantified in the HFD+EMPA and HFD+veh groups. (n = 10 images per group). M–P) Optical mapping of hearts isolated from the NC+veh, HFD+Vehicle, and HFD+EMPA group stimulated at 8 Hz pacing. Statistical analysis of Ca2⁺ fluorescence signal conduction velocity (N), amplitude (O), and maximum upstroke speed (P) were derived from over three recordings from one mouse per group. Q) Lactate dehydrogenase (LDH) levels were measured in the serum of mice from the NC‐Veh, HFD‐Veh, and HFD+EMPA groups (n = 6 mice per group). R,S) Representative fluorescent images (R) and quantification (S) of apoptotic cardiomyocyte rates in heart sections from each group are shown. Data were obtained from n = 3 mice per group, with at least three high‐power fields analyzed per mouse. Bars = 50 µm. ns p > 0.05, *p < 0.05, **p < 0.01, ***p < 0.001, ****p < 0.0001.

Similar articles

References

    1. Magliano D. J., Boyko E. J., IDF Diabetes Atlas, in Idf Diabetes Atlas, International Diabetes Federation © International Diabetes Federation, Brussels: 2021.
    1. Li Y., Teng D., Shi X., Qin G., Qin Y., Quan H., Shi B., Sun H., Ba J., Chen B., Du J., He L., Lai X., Li Y., Chi H., Liao E., Liu C., Liu L., Tang X., Tong N., Wang G., Zhang J.‐A., Wang Y., Xue Y., Yan L., Yang J., Yang L., Yao Y., Ye Z., Zhang Q., et al., BMJ 2020, 369, m997. - PMC - PubMed
    1. Wong N. D., Sattar N., Nat. Rev. Cardiol. 2023, 20, 685. - PubMed
    1. Shah A. D., Langenberg C., Rapsomaniki E., Denaxas S., Pujades‐Rodriguez M., Gale C. P., Deanfield J., Smeeth L., Timmis A., Hemingway H., Lancet Diabetes Endocrinol. 2015, 3, 105. - PMC - PubMed
    1. Kenny H. C., Abel E. D., Circ. Res. 2019, 124, 121. - PMC - PubMed

MeSH terms

LinkOut - more resources