. 2025 Jul;12(25):e2417593.
doi: 10.1002/advs.202417593. Epub 2025 May 28.

Immunotyping the Tumor Microenvironment Reveals Molecular Heterogeneity for Personalized Immunotherapy in Cancer

Affiliations

Immunotyping the Tumor Microenvironment Reveals Molecular Heterogeneity for Personalized Immunotherapy in Cancer

Dongqiang Zeng et al. Adv Sci (Weinh). 2025 Jul.

Abstract

The tumor microenvironment (TME) significantly influences cancer prognosis and therapeutic outcomes, yet its composition remains highly heterogeneous, and currently, no highly accessible, high-throughput method exists to define it. To address this complexity, the TMEclassifier, a machine-learning tool that classifies cancers into three distinct subtypes: immune Exclusive (IE), immune Suppressive (IS), and immune Activated (IA), is developed. Bulk RNA sequencing categorizes patient samples by TME subtype, and in vivo mouse model validates TME subtype differences and differential responses to immunotherapy. The IE subtype is marked by high stromal cell abundance, associated with aggressive cancer phenotypes. The IS subtype features myeloid-derived suppressor cell infiltration, intensifying immunosuppression. In contrast, the IA subtype, often linked to EBV/MSI, exhibits robust T-cell presence and improved immunotherapy response. Single-cell RNA sequencing is applied to explore TME cellular heterogeneity, and in vivo experiments demonstrate that targeting IL-1 counteracts immunosuppression of IS subtype and markedly improves its responsiveness to immunotherapy. TMEclassifier predictions are validated in this prospective gastric cancer cohort (TIMES-001) and other diverse cohorts. This classifier could effectively stratify patients, guiding personalized immunotherapeutic strategies to enhance precision and overcome resistance.

Keywords: IL‐1; cancer; immunotherapy; immunotyping; tumor microenvironment.


Conflict of interest statement

The authors declare no conflict of interest.

Figures

Figure 1
Figure 1
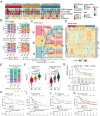
Workflow and Graphical methodological overview of the TMEclassifier construction and TME subtype‐specific analysis. ACRG, The Asian Cancer Research Group; TME, tumor microenvironment; IE, Immune Exclusive (red), IS, Immune Suppressive (orange), IA, Immune Activated (blue); TME, Tumor Microenvironment; SVM, support vector machine; RF, random forest; NNET, neural network; XGBoost, extreme gradient boost; DecTree, decision tree; KNN, K nearest neighbor; scRNAseq, single‐cell RNA sequencing; GC, gastric cancer. IO, Immunotherapy.
Figure 2
Figure 2
Association of TME subtypes with clinical features, immunotherapy efficacy biomarkers, and survival outcomes. A) Heatmap showing clinical information, including ACRG subtypes, AJCC stage, Lauren subtypes, EBV status and TMEscore across three TME subtypes identified by the TMEclassifier. B) Proportion of different clinical characteristics among the three TME subtypes in ACRG cohort shown by bar plots. C) Alluvial diagram depicting the relationship between TME subtypes by TMEclassifier, TME subtypes by TME cell infiltration, ACRG subtypes, TMEscore and MSI status. D) Heatmap of the expression of immune‐ and stromal‐related genes among three TME subtypes in ACRG cohort. E) The TCGA subtypes proportion among three TME subtypes in TCGA‐STAD cohort shown by bar plot. F) Box plots of difference in TMEscore among TME subtypes in ACRG cohort and TCGA‐STAD cohort. G) Kaplan–Meier curves of overall survival (OS) for patients in subgroups stratified by TME subtypes and receipt of adjuvant therapy of patients from ACRG cohort. H–K) Survival analysis of patients by TME subtypes in the gastric cancer cohorts including the ACGR cohort (H), TCGA‐STAD cohort (I), GSE84437 cohort (J), and GC meta‐cohort (K). In box plots, p values were calculated using the Mann–Whitney test for comparisons between two groups, and the Kruskal‐Wallis test was used to calculate p values for comparisons of more than two groups. In bar plots, the Chi‐squared test p values were displayed at the top of the figure. The log‐rank test was used to assess the statistical significance of the prognostic differences among the subtypes in the survival analyses above. EMT, epithelial–mesenchymal transition; MSI, microsatellite instability; MSS, microsatellite stable; AJCC, The American Joint Committee on Cancer; EBV, Epstein‐Barr virus; TCGA, The Cancer Genome Atlas; STAD, stomach adenocarcinoma; CIN, chromosomal instability; GS, genomically stable; ADJ, adjuvant therapy; Obs, observation.
Figure 3
Figure 3
TME landscape and dynamic evolution of the three TME subtypes. A) Heatmap showing the distribution of 300 samples from the ACRG cohort across three TME subtypes identified by TME classifier (columns) and the infiltration levels of the 23 immune cell types in three TME subtypes (rows). B) Different infiltrated cell types among three TME subtypes in ACRG cohort (upper) and TCGA‐STAD cohort (GC Validation 1, bottom). C) Uniform manifold approximation and projection (UMAP) plot of the annotations for seven basal cell types from single cell RNA‐seq data of 40 gastric cancer samples. D) Heatmap comparing the expression of different cell types scores in the seven basal cell clusters. E) Donut plot showing the proportion of three TME subtypes (inner circle) and the comparison of seven basal cell clusters of each TME subtype (outer circle) from scRNA‐seq data. F) T cell landscape of TME subtypes at single‐cell resolution (OMIX001073, n = 10). UMAP plot annotated with T cell types from single‐cell RNA‐seq data of ten gastric cancer samples. G) Heatmap showing the preferential distribution of T cell subgroups across different TME subtypes. H–J) UMAP plot showing pseudo time ordering of TME subtypes in the ACRG cohort (H), TCGA‐STAD cohort (GC Validation cohort‐1, I), and GSE84437 cohort (GC Validation cohort‐2, J). Each point corresponds to a sample and is color‐coded by TME subtypes (left) and differentiation score (right).
Figure 4
Figure 4
The relationship between TME subtypes and IL‐1/IL‐1R1 and other biological characteristics. A) Pathways enriched in each TME subtype represented on heatmap in ACRG cohort. B) DEGs involved in interleukin signaling among three TME subtypes in ACRG cohort. C) Differences in IL1‐A, IL1‐B, IL1‐R1 and IL‐33 expression among three TME subtypes in ACRG cohort. p values were calculated using the Mann–Whitney test for comparison between two groups, and the Kruskal‐Wallis test was used to calculate p values for comparisons of more than two groups. D) Differential cell‐cell interaction network of IS subtype compared to IE and IA. Different circles represent different cell types colored according to TME subtypes. The circle sizes represent the statistical significance of each cell types. Edges are weighted by the cell‐cell interactions of the connective cell types. E) Differential ligand‐receptor interactions among three TME subtypes represented on heatmap. F,G) Correlation heatmaps showing the relationship between IL1A/B expression and immunosuppression‐related signatures in the ACRG (F) and TCGA‐STAD cohorts (G). The correlation coefficient was computed using Spearman analysis. H,I) The expression of IL1‐B in the seven basal cell clusters by UMAP plot (H) and box plot (I). In box plots, p values were calculated using the Mann–Whitney test for comparisons between two groups. In the tumor growth curve graph, the two‐way ANOVA analysis method was used to compare the differences in tumor size between the two groups. Error bars represent the mean ± SD; ns, no significance; *, p < 0.05; **, p < 0.01; ***, p < 0.001; ****, p < 0.0001.
Figure 5
Figure 5
A) Pie charts displaying the distribution of different TME subtypes in the three types of subcutaneous tumors (n = 7 per group). B) The flow chart of treatment protocol. C–E) Images and growth curves of subcutaneous tumors formed by three cell lines (n = 5 per group). F) The flow chart of treatment protocol. G) Images and growth curves of subcutaneous tumors formed by three cell lines (n = 5 per group). H) Representative IHC images showing differential CD8+ T cell infiltration in subcutaneous tumors of the four groups and quantification of positive cell density (right panel; n = 5 per group). I,J) Representative flow cytometer results showing cytokine expression levels of CD8+ T cell of the four groups and quantification of positive subpopulation (right panel; n = 5 per group) In box plots, p values were calculated using the Mann–Whitney test for comparisons between two groups. In the tumor growth curve graph, the two‐way ANOVA analysis method was used to compare the differences in tumor size between the two groups. Error bars represent the mean ± SD; ns, no significance; *, p < 0.05; **, p < 0.01; ***, p < 0.001; ****, p < 0.0001.
Figure 6
Figure 6
Validation of TME Typing as a Predictive Biomarker for Immunotherapy Response in Gastric Cancer and Other Tumor Types. A) Kaplan–Meier curves of progression‐free survival (PFS) by TME subtypes in our TIMES001 prospective clinical trial (NCT04850716, n = 93). B) Box plots of difference in TMEscore among TME subtypes in TIMES001 clinical trial. C) Kaplan–Meier curves of PFS by CPS (top: cutoff = 1; bottom: cutoff = 5) in the TIMES001 clinical trial. D) Receiver operating characteristic (ROC) analyses showing the comparison of TMEclassifier, MFP classifier, GSClassifier, TIDE, and PD‐L1 CPS for predicting ICBs response in the TIMES001 clinical trial. E) Receiver operating characteristic analyses showing the comparison of TMEclassifier, MFP classifier, GSClassifier, TIDE, and PD‐L1 CPS for predicting 8 months or more PFS (bottom) in the TIMES001 clinical trial. F) Kaplan–Meier curves of progression‐free survival (PFS) by TME subtypes in the GC NanoString cohort (GC IO cohort 2, n = 44). G) Kaplan–Meier curves of OS by TME subtypes in the IMvigor210 cohort (NCT02108652, n = 348). H) Left panel: Kaplan–Meier curves of OS by TME subtypes with different treatments of patients from the OAK and POPLAR combined cohort (NCT02008227 and NCT01903993, n = 891). Each group was color‐coded as follows: IE with chemotherapy, pink; IS with chemotherapy, yellow; IA with chemotherapy, wathet; IE with immunotherapy, red; IS with immunotherapy, orange and IA with immunotherapy, blue. Right panels: Proportion of tTMB level (upper) and PD‐L1 TPS (bottom) among three TME subtypes of patients in OAK and POPLAR cohort. In box plots, p values were calculated using the Mann–Whitney test for comparison between two groups, and the Kruskal‐Wallis test was used to calculate p values for comparisons of more than two groups. In bar plots, the Chi‐squared test p values are displayed at the top of the figure. The log‐rank test was used to assess the statistical significance of the prognostic differences among the subtypes in the survival analyses above. CR, complete response; PR, partial response; SD, stable disease; PD, progressive disease; tTMB, tissue tumor mutation burden; CPS, PD‐L1 combined positive score; TPS, PD‐L1 tumor proportion score.
Figure 7
Figure 7
Graphical abstract for comprehensive characterization of TME subtypes of gastric cancer. The three TME subtypes displayed significantly distinct cellular and molecular features. TMB: tumor mutational burden; F‐TBRS, pan‐fibroblast TGF‐β response signature; CAFs, cancer‐associated fibroblasts; CTL, cytotoxic T lymphocyte.

References

    1. Shitara K., Ajani J. A., Moehler M., Garrido M., Gallardo C., Shen L., Yamaguchi K., Wyrwicz L., Skoczylas T., Bragagnoli A. C., Liu T., Tehfe M., Elimova E., Bruges R., Zander T., de Azevedo S., Kowalyszyn R., Pazo‐Cid R., Schenker M., Cleary J. M., Yanez P., Feeney K., Karamouzis M. V., Poulart V., Lei M., Xiao H., Kondo K., Li M., Janjigian Y. Y., Nature 2022, 603, 942. - PMC - PubMed
    1. a) Shitara K., Ozguroglu M., Bang Y. J., Di Bartolomeo M., Mandala M., Ryu M. H., Fornaro L., Olesinski T., Caglevic C., Chung H. C., Muro K., Goekkurt E., Mansoor W., McDermott R. S., Shacham‐Shmueli E., Chen X., Mayo C., Kang S. P., A. Ohtsu, C. S. Fuchs, K.‐. investigators , Lancet 2018, 392, 123;
    2. b) Kang Y. K., Boku N., Satoh T., Ryu M. H., Chao Y., Kato K., Chung H. C., Chen J. S., Muro K., Kang W. K., Yeh K. H., Yoshikawa T., Oh S. C., Bai L. Y., Tamura T., Lee K. W., Hamamoto Y., Kim J. G., Chin K., Oh D. Y., Minashi K., Cho J. Y., Tsuda M., Chen L. T., Lancet 2017, 390, 2461,; - PubMed
    3. c) Guinney J., Dienstmann R., Wang X., de Reynies A., Schlicker A., Soneson C., Marisa L., Roepman P., Nyamundanda G., Angelino P., Bot B. M., Morris J. S., Simon I. M., Gerster S., Fessler E., De Sousa E. M. F., Missiaglia E., Ramay H., Barras D., Homicsko K., Maru D., Manyam G. C., Broom B., Boige V., Perez‐Villamil B., Laderas T., Salazar R., Gray J. W., Hanahan D., Tabernero J., et al., Nat. Med. 2015, 21, 1350. - PMC - PubMed
    1. Chia S. K., Bramwell V. H., Tu D., Shepherd L. E., Jiang S., Vickery T., Mardis E., Leung S., Ung K., Pritchard K. I., Parker J. S., Bernard P. S., Perou C. M., Ellis M. J., Nielsen T. O., Clin. Cancer Res. 2012, 18, 4465. - PMC - PubMed
    1. Martin‐Serrano M. A., Kepecs B., Torres‐Martin M., Bramel E. R., Haber P. K., Merritt E., Rialdi A., Param N. J., Maeda M., Lindblad K. E., Carter J. K., Barcena‐Varela M., Mazzaferro V., Schwartz M., Affo S., Schwabe R. F., Villanueva A., Guccione E., Friedman S. L., Lujambio A., Tocheva A., Llovet J. M., Thung S. N., Tsankov A. M., Sia D., Gut 2023, 72, 736. - PMC - PubMed
    1. Kirchhammer T. M., der Maur P. A., Läubli H., Zippelius A., Nature 2014, 513, 202

LinkOut - more resources