Multicenter Study
. 2025 Jul;12(28):e03499.
doi: 10.1002/advs.202503499. Epub 2025 May 28.

Blood Biomarker-Based Predictive Indicator for Liver Metastasis in Alpha-Fetoprotein-Producing Gastric Cancer and Multi-Omics Tumor Microenvironment Insights

Affiliations
Multicenter Study

Blood Biomarker-Based Predictive Indicator for Liver Metastasis in Alpha-Fetoprotein-Producing Gastric Cancer and Multi-Omics Tumor Microenvironment Insights

Yongfeng Ding et al. Adv Sci (Weinh). 2025 Jul.

Abstract

Alpha-fetoprotein-producing gastric cancer (AFPGC) is a rare but highly aggressive subtype of gastric cancer. Patients with AFPGC are at high risk of liver metastasis, and the tumor microenvironment (TME) is complex. A multicenter retrospective study is conducted from January 2011 to December 2021 and included 317 AFPGC patients. Using a multivariable logistic regression model, a nomogram for predicting liver metastasis is built. By combining AFP and the neutrophil-lymphocyte ratio (NLR), we developed a novel and easily applicable predictive indicator, termed ANLiM score, for liver metastasis in AFPGC. An integrated multi-omics analysis, including whole-exome sequencing and proteomic analysis, is conducted and revealed an immunosuppressive TME in AFPGC with liver metastasis. Single-cell RNA sequencing and multiplex immunofluorescence identified the potential roles of tumor-associated neutrophils and tertiary lymphoid structures in shaping the immune microenvironment. These findings are validated in a real-world cohort receiving anti-programmed cell death 1 (anti-PD-1) therapy, which showed concordant effectiveness. In addition, the ANLiM score is also identified as a promising biomarker for predicting immunotherapy efficacy. Overall, a blood biomarker-based predictive indicator is developed for liver metastasis and immunotherapy response in AFPGC. The findings on immune microenvironmental alterations for AFPGC with liver metastasis provide new insights for optimizing immunotherapy strategies.

Keywords: alpha‐fetoprotein‐producing gastric cancer; immunotherapy; liver metastasis; tumor microenvironment.


Conflict of interest statement

The authors declare no conflict of interest.

Figures
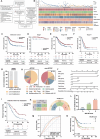
Figure 1
Figure 1
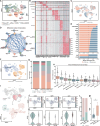
Clinicopathological characteristics of AFPGC cohort and the construction of ANLiM as a predictive biomarker for liver metastasis. A) Screening workflow for the multicenter AFPGC Cohort. B) Distribution of clinicopathological characteristics AFPGC cohort. The survival time and survival status of each patient are displayed above the figure. Comparison of overall survival between AFPGC cohort and non‐AFPGC cohort C), as well as across various TNM stages D–F). G) The incidence of liver metastasis in AFPGC and non‐AFPGC cohorts. H) Comparison of metastatic pattern between two cohorts. I) Comparison of overall survival between two cohorts. J) A nomogram for predicting synchronous liver metastasis of AFPGC. K) Development and calculation of the ANLiM Score. (e.g., serum AFP = 320 ng/mL, NLR = 4.2, yielding ANLiM = 2; serum AFP = 98 ng/mL, NLR = 2.8, yielding ANLiM = 1) L) Relationship between the ANLiM score and the incidence of synchronous liver metastasis. M) Comparison of the predictive ability of ANLiM score with AFP and NLR for Liver Metastasis in AFPGC. N) Survival curves of AFPGC stratified by different ANLiM scores. NA, not available. **** p < 0.0001.
Figure 2
Figure 2
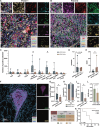
Characterization of molecular features and microenvironmental changes associated with liver metastasis in AFPGC. A) Schematic workflow for genomic sequencing and proteomic analysis. B) The landscape of gene alterations among AFPGC LM (−), AFPGC LM (+), and MSKCC‐GC LM (+) groups. The middle panel displays somatic mutations across genes (rows) and tumor samples (columns), while the left panel annotates cancer‐related signaling pathways for these genes. The bottom panel presents different clinicopathological features. C) Comparison of gene alteration frequencies among different groups. D,E) Comparison of wGII index D) and polyclonality E) between two groups. F,G) Comparison of wGII index (F) and polyclonality G) between high ANLiM score and low ANLiM score groups. H,I) Comparison of TMB H) and TNB I) between two groups. J) PCA analysis of AFPGC tumor samples and adjacent normal tissues. K) Volcano plot of DEPs between two groups. L) Pathway enrichment analyses of DEPs. M) Heatmap of DEPs associated with immune process or metastasis in AFPGC LM(−) and AFPGC LM(+) groups. N,O) Comparison of ImmuneScores N) and TLS scores O) between AFPGC LM(−) and AFPGC LM(+) groups. P,Q) Comparison of ssGSEA enrichment scores for STING P) and IFNG Q) pathways. LM, liver metastasis; NAT, normal adjacent tissue; FFT, fresh frozen tissue; FFPE, formalin‐fixed paraffin‐embedded tissue; LM(−), the absence of liver metastasis; LM(+), the presence of liver metastasis; RTK, Receptor Tyrosine Kinase; wGII, weighted genomic instability index; PCA, principal component analysis; ssGSEA, single‐sample gene set enrichment analysis; NA, not available. * p < 0.05; ** p < 0.01; ns, no significance.
Figure 3
Figure 3
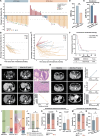
Single‐cell analysis reveals immune cells in the tumor microenvironment of AFPGC. A) UMAP plots depicting distinct cell types present in AFPGC. B) Gene expression heatmap in distinct cell types. C) UMAP plots showing cell clustering, colored with AFPGC LM(−) and AFPGC LM(+). D) The differences in the number of interactions between AFPGC LM(+) group and LM(−) group. Red (blue) edges indicate that the number of interactions increases (decreases) in the LM(+) group. E) Active Receptor‐Ligand Pathways in AFPGC LM(+) and AFPGC LM(−). F) UMAP plots showing cell clustering, colored with immune cells and non‐immune cells. G) Proportional distribution of different immune cells in AFPGC. H) Immune‐inhibitory scores of each cell type in AFPGC. I) Neutrophils were divided into 2 clusters (N2 and non‐N2) using UMAP plot. J,K) Expression of VEGFA, MMP9, and OLR1 in N2 and non‐N2 clusters. L) Differential distribution of N2 and non‐N2 subsets among TANs in AFPGC with and without LM. M) The comparison of N2/N1 ratio between AFPGC LM(−) and AFPGC LM(+) based on ssGSEA analysis using proteomics data. UMAP, uniform manifold approximation and projection; TANs, tumor‐associated neutrophils; * p < 0.05.
Figure 4
Figure 4
Comparison of tumor immune microenvironment of AFPGC using mIF. A) Representative mIF images in AFPGC stained for antibodies in panel 1. Panel 1 consisted of CD66b, HLA‐DR, CD11c, MMP9, TGF‐β and PD‐L1. B) Representative mIF images in AFPGC stained for antibodies in panel 2. Panel 2 consisted of CD4, CD8, FoxP3, CD20, CD21 and CD23. C) Box plots showing the cell density (number of cells per mm2) between AFPGC LM(−) and AFPGC LM(+). D,E) Comparison of CD4/CD8 ratio D) and N2/N1 ratio E) between AFPGC LM(−) and AFPGC LM(+). F) A typical image of a mature tertiary lymphoid structure using mIF. G,H) Comparison of the density G) and TLS positivity H) between AFPGC LM(−) and AFPGC LM(+). I) Calculation of the mIF‐based immune score. * represents N2/N1 > 0.8, which refers to the result of ssGSEA analysis using proteomics data. (e.g., The presence of TLS, N2/N1 ratio = 0.9, yielding score = 1) J) Comparison of mIF‐based immune score between AFPGC LM(−) and AFPGC LM(+) groups. K) Comparison of overall survival between high and low immune score groups. L) The relation between mIF‐based immune score and ANLiM scores. mIF, multiplex immunofluorescence; * p < 0.05.
Figure 5
Figure 5
The efficacy of immunotherapy in AFPGC patients and the role of ANLiM as a predictive marker. A) Efficacy of immunotherapy (anti‐PD‐1 therapy) in combination with chemotherapy in AFPGC LM(−) and AFPGC LM(+) groups, respectively. B,C) Spider plots showing treatment responses for all patients in AFPGC LM(−) group. B) and in AFPGC LM(+) group C). D) The ORR for immunotherapy in combination with chemotherapy in AFPGC LM (−) and AFPGC LM (+) patients, respectively. E) Comparison of pCR rate of neoadjuvant chemoimmunotherapy between AFPGC LM(−) and non‐AFPGC LM(−). F) Comparison of PFS between AFPGC LM(+) and non‐AFPGC LM(+) patients receiving first‐line ICI combination therapy. G) Representative case showing reduced tumor lesions of AFPGC LM(−) after immunotherapy‐based neoadjuvant treatment and achieving pCR. ’BASELINE’ indicates the starting point for comparison. H) Representative case showing tumor progression of AFPGC LM(+) after 2 cycles immunotherapy‐based treatment. I) Sankey diagram illustrating the relationships between different MMR statuses, PD‐L1 expression levels, and therapeutic efficacy. J) Association between ANLiM score and TIDE predicted response. K,L) Association between ANLiM score and response to neoadjuvant chemoimmunotherapy in AFPGC LM(−). M,N) Association between ANLiM score and response to first‐line ICI combination therapy in AFPGC LM(−). PD, progressive disease; SD, stable disease; PR, partial response; ORR, objective response rate; pMMR, proficient mismatch repair; dMMR, deficient mismatch repair; CPS, combined positive score; ICI: immune checkpoint inhibitor; SOD, sum of longest diameters; * p < 0.05; ** p < 0.01.

Similar articles

Cited by

References

    1. Bray F., Laversanne M., Sung H., Ferlay J., Siegel R. L., Soerjomataram I., Jemal A., CA Cancer J. Clin. 2024, 74, 229. - PubMed
    1. Lu J., Ding Y., Chen Y., Jiang J., Chen Y., Huang Y., Wu M., Li C., Kong M., Zhao W., Wang H., Zhang J., Li Z., Lu Y., Yu X., Jin K., Zhou D., Zhou T., Teng F., Zhang H., Zhou Z., Wang H., Teng L., Nat. Commun. 2021, 12, 3946. - PMC - PubMed
    1. Hirajima S., Komatsu S., Ichikawa D., Kubota T., Okamoto K., Shiozaki A., Fujiwara H., Konishi H., Ikoma H., Otsuji E., World J. Gastroenterol. 2013, 19, 6055. - PMC - PubMed
    1. Zhang F., Am. J. Cancer Res. 2024, 14, 2124. - PMC - PubMed
    1. Chang Y. C., Nagasue N., Abe S., Taniura H., Kumar D. D., Nakamura T., Am. J. Gastroenterol. 1992, 87, 321. - PubMed

Publication types

LinkOut - more resources