. 2025 Aug;12(30):e04188.
doi: 10.1002/advs.202504188. Epub 2025 May 28.

Neutrophil-Mimicking Nanomedicine Eliminates Tumor Intracellular Bacteria and Enhances Chemotherapy on Liver Metastasis of Colorectal Cancer

Affiliations

Neutrophil-Mimicking Nanomedicine Eliminates Tumor Intracellular Bacteria and Enhances Chemotherapy on Liver Metastasis of Colorectal Cancer

Yanan Niu et al. Adv Sci (Weinh). 2025 Aug.

Abstract

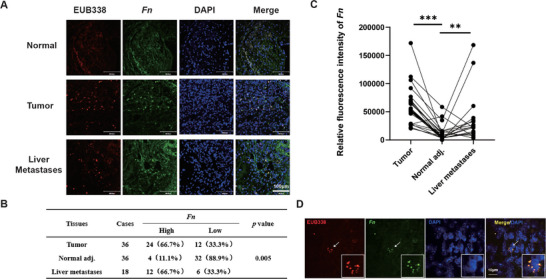
Fusobacterium nucleatum (Fn) enrichment has been identified in colorectal cancer and its liver metastases. In this study, we found that Fn predominantly accumulated within colorectal cancer cells, correlating with colorectal cancer liver metastasis. Clinically, the administration of high doses of antibiotics and chemotherapeutic agents can disrupt the balance of the host microbiota. To address this clinical challenge, metronidazole (MTI) and oxaliplatin (OXA) are encapsulated within poly (lactic-co-glycolic acid) (PLGA) nanoparticles. Neutrophil membrane vesicles are extracted from murine bone marrow and coated with these nanoparticles (NM@PLGA-MTI-OXA), creating neutrophil-mimetic nanoparticles with dual targeting capabilities for antibacterial and anticancer purposes. The neutrophil membrane coating, compared with free drugs, is found to enhance nanoparticle uptake by tumor cells, facilitating intracellular bacterial elimination and tumor cell death. Further experiments reveal that NM@PLGA-MTI-OXA reverses the Fn-induced epithelial-mesenchymal transition (EMT) in tumor cells during metastasis and remodels the immunosuppressive microenvironment, suppressing colorectal cancer and liver metastasis development while minimizing broad-spectrum damage to the commensal microbiota.

Keywords: colorectal cancer; liver metastasis; nanomedicine; tumor microbiome.


Conflict of interest statement

The authors declare no conflict of interest.

Figures

Scheme 1
Scheme 1
Schematic illustration of the study. A) Synthetic process of neutrophil‐mimicking nanoparticles NM@PLGA‐MTI‐OXA. B) NM@PLGA‐MTI‐OXA remodeled the tumor immune microenvironment and reversed the Fn‐mediated EMT process to enhance chemotherapy on liver metastasis of colorectal cancer by depleting intratumoral Fn.
Figure 1
Figure 1
Fn was highly enriched in CRC and liver metastases A) Representative images of human colorectal cancer, matched adjacent nontumor tissues, and liver metastases tissues stained with Fn‐specific probe FUS664 (green) and universal bacterial probe EUB338 (red); cell nucleoid was stained with DAPI (blue). Scale bar = 100 µm B) Quantitative analysis of Fn FISH plaque. C) Quantitative analysis of an Fn FISH fluorescence. D) Representative images of human colorectal cancer cells stained with Fn‐specific probe FUS664 (green) and universal bacterial probe EUB338 (red); the cell nucleoid was stained with DAPI (blue). Scale bar = 10 µm. * p < 0.05; ** p < 0.01; *** p < 0.001.
Figure 2
Figure 2
Characterization and tumor targeting of neutrophil‐mimicking nanoparticles. A) Western‐blot identification and comparison of membrane‐associated adhesive proteins, including L‐selectin, β1 integrin, β2 integrin CXCR4. B) Zeta potential C) Particle size. D)TEM image. Scale bar = 200 µm E) CLSM images of CT26 cells treated with Cy5.5, PLGA‐Cy5.5, and NM@PLGA‐Cy5.5 for 1, 6, and 12h. Cell nuclei were stained with DAPI. Scale bar = 30 µm. F) Representative images of vital organs and tumor after 2, 6, 12, and 24h post‐injection of Cy5.5, PLGA‐MTI‐OXA‐Cy5.5, and NM@ PLGA‐MTI‐OXA‐Cy5.5.
Figure 3
Figure 3
Bactericidal and tumor cell killing effect of neutrophil‐mimicking nanoparticles in vitro. A) Antibacterial efficiency of different drugs after 48h by paper diffusion assay. B) CLSM images of live/dead Fn stained with SYTO9/PI treated with different drugs for 6h as before. Scale bar = 100 µm. C) SEM micrographs of Fn treated with PBS (control), MTI, OXA, MTI+OXA, PLGA‐MTI‐OXA, and NM@ PLGA‐MTI‐OXA for 6 h. Scale bar = 1 µm. D,E) Cell viability after treatment of CT26 cells and MC38 with different concentrations of different drugs for 24 h. F) Flow cytometry analysis with Annexin V/PI staining evaluating the percentages of apoptotic cells among different drug treatment groups. G) Wound healing assay of CT26 cells treated with different drugs for 12 h. H) Colony plate images after cell lysis, cultured with Fn and then treated with PBS (control), MTI, OXA, MTI+OXA, PLGA‐MTI‐OXA, and NM@ PLGA‐MTI‐OXA at 6 h. I) The expression of EMT related protein, including Vimentin, Slug, and Snail, after being infected with Fn for 2h and treated with different drugs for 24 h. J) The schematic diagram illustrates the mode of action wherein Neutrophil‐Mimicking nanoparticles conjugate with cell membrane surface markers to enter cells, releasing antibiotics to kill bacteria and simultaneously releasing oxaliplatin to damage tumor cells. * p < 0.05; ** p < 0.01; *** p < 0.001.
Figure 4
Figure 4
Neutrophil‐mimicking nanoparticles can effectively delay the progression of an AD/Fn CRC spontaneous model. A) Timeline of the spontaneous model of CRC in vivo treatment. B) General view of the mouse colorectum and anatomical atlas of the interior colorectum after dissection. C) Length of the mouse colorectum. D) Statistical graph of the number of tumor nodules in the mouse colorectum. E) Quantitative analysis of Fn FISH plaques in F. F) Photographs of CLSM taken by FISH to detect Fn infiltration in colorectal sites of tumors, blue: DAPI‐labeled nuclei, red: CY5‐EUB338 universal bacterial probes, green: FAM‐FUS664 probe, scale bar = 100 µm. (n = 5 or 6) * p < 0.05; ** p < 0.01; *** p < 0.001.
Figure 5
Figure 5
Neutrophil‐mimicking nanoparticles can effectively delay the progression of Fn‐infected liver metastasis model. A) Timeline of Fn‐infected liver metastasis model. B) IVIS images of bioluminescence signal of the luciferase assay for each mouse at Day 14. C) General view of representative dissected liver at day 14. D) Quantitative analysis of fluorescence in (B). E) Statistical graph of the number of tumor nodules in liver metastasis. F) The liver weight in groups treated with different drugs. G) Quantitative analysis of Fn FISH plaques in H. H) Photographs of CLSM taken by FISH to detect Fn infiltration in liver metastasis sites, blue: DAPI‐labeled nuclei, red: CY5‐EUB338 universal bacterial probes, green: FAM‐FUS664 probe, scale bar = 100 µm. (n = 3) * p < 0.05; ** p < 0.01; *** p < 0.001.
Figure 6
Figure 6
Neutrophil‐mimicking nanoparticles maintained intestinal flora balance in AD/Fn CRC spontaneous model. A) Analysis of alpha diversity of intestinal flora, Shannon index, and Simpson index was observed by 16S rDNA sequencing. B) Microbiota dysbiosis index (MDI) of different groups. C) Venn analysis of species in different treatment groups. D) Community heatmap analysis on the genus level was performed to explore the differences in intestinal flora composition after different drug treatments. E) Stacked bar plot of the phylum level relative abundance of bacteria communities in the indicated samples. F) Differential analysis of the top 4 fecal flora in abundance in different treatment groups at the phylum level. G) Quantitative analysis of the top 3 fecal flora in abundance in different treatment groups at the phylum level. (n = 3) * p < 0.05; ** p < 0.01; *** p < 0.001.
Figure 7
Figure 7
Neutrophil‐mimicking nanoparticles remodeled the tumor immune microenvironment and reversed the Fn‐mediated EMT process in Fn‐infected liver metastasis model. A) Representative IHC staining images of CD3, CD4, CD8 in Fn‐infected liver metastasis tissues. Scale bar = 200 µm. B,C,D) Quantitative analysis in A. E,F) Cytokine levels of IL‐6, and IL‐10 in serum were detected through ELISA among different treated groups. G) Representative IHC staining images of Ki67, N‐cadherin, slug, and snail in Fn‐infected liver metastasis tissues. Scale bar = 200 µm. H,I) Quantitative analysis in G. (n = 3) * p < 0.05; ** p < 0.01; *** p < 0.001.

Similar articles

References

    1. Bray F., Laversanne M., Sung H., Ferlay J., Siegel R. L., Soerjomataram I., Jemal A., CA: Cancer J. Clin. 2024, 74, 229. - PubMed
    1. Murphy C. C., Zaki T. A., Nat. Rev. Gastroenterol. Hepatol. 2024, 21, 25. - PubMed
    1. Shin A. E., Giancotti F. G., Rustgi A. K., Trends Pharmacol. Sci. 2023, 44, 222. - PMC - PubMed
    1. Rumpold H., Niedersüß‐Beke D., Heiler C., Falch D., Wundsam H. V., Metz‐Gercek S., Piringer G., Thaler J., BMC Cancer 2020, 20, 1149. - PMC - PubMed
    1. Morris V. K., Kennedy E. B., Baxter N. N., Benson A. B., Cercek A., Cho M., Ciombor K. K., Cremolini C., Davis A., Deming D. A., Fakih M. G., Gholami S., Hong T. S., Jaiyesimi I., Klute K., Lieu C., Sanoff H., Strickler J. H., White S., Willis J. A., Eng C., J. Clin. Oncol. 2023, 41, 678. - PMC - PubMed

MeSH terms

LinkOut - more resources