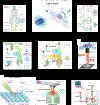
Chemical imaging for biological systems: techniques, AI-driven processing, and applications
- PMID: 40433910
- PMCID: PMC12208185
- DOI: 10.1039/d4tb02876g
Chemical imaging for biological systems: techniques, AI-driven processing, and applications
Abstract
Visualizing the chemical compositions of biological samples is pivotal to advancing biological sciences, with the past two decades witnessing the emergence of innovative chemical imaging platforms such as single-molecule imaging, coherent Raman scattering microscopy, transient absorption microscopy, photothermal microscopy, ambient ionization mass spectrometry, electrochemical microscopy, and advanced chemical probes. These technologies have enabled significant breakthroughs in diagnosing pathological transitions, designing targeted therapies, and understanding drug resistance mechanisms. Recent advancements in resolution, contrast, sensitivity, and speed have transformed the field, with techniques like fluorescence, infrared absorption, and Raman scattering being widely applied across diverse biological domains. This review provides a comprehensive overview of the evolution and current state of chemical imaging technologies, coupled with systematic analyses of data processing workflows, including pre-processing, machine learning-assisted pattern extraction, and neural network-based predictions. Artificial intelligence (AI) and machine learning-assisted imaging are transforming chemical imaging through key advancements such as improved resolution and sensitivity via noise reduction techniques, enhanced data analysis (e.g., spectral unmixing, pattern recognition), automated feature extraction using neural networks, real-time processing via high-performance cluster, and data fusion across optical platforms. These innovations are significantly advancing both current applications and the future development of chemical imaging techniques in biomedical research. However, several critical challenges remain, including the scarcity of high-quality training datasets, limited generalizability across different instruments and experimental conditions, high computational costs, challenges in output interpretability and trust, and the lack of standardized validation protocols across different approaches. Looking ahead, the integration of bioimaging into cell biology, lipid research, tumor studies, microbiology, neurobiology, and developmental biology is anticipated to expand its impact, aided by interdisciplinary expertise in biochemistry, physics, and optical engineering. These developments promise unprecedented resolution and speed, facilitating high-speed, high-resolution imaging of living systems, with applications leading to discoveries such as biomarkers for cancer aggressiveness and drug resistance. Moreover, the miniaturization and commercialization of imaging platforms are broadening accessibility, enabling on-site clinical investigations and in vivo measurements, underscoring the transformative potential of chemical imaging in advancing biological science and medical research.
Figures


Similar articles
-
Artificial Intelligence-Assisted Visualized Microspheres for Biochemical Analysis: From Encoding to Decoding.Acc Chem Res. 2025 Aug 19;58(16):2627-2639. doi: 10.1021/acs.accounts.5c00396. Epub 2025 Aug 1. Acc Chem Res. 2025. PMID: 40748254
-
The Use of AI for Phenotype-Genotype Mapping.Methods Mol Biol. 2025;2952:369-410. doi: 10.1007/978-1-0716-4690-8_21. Methods Mol Biol. 2025. PMID: 40553344
-
Advancements in AI for Computational Biology and Bioinformatics: A Comprehensive Review.Methods Mol Biol. 2025;2952:87-105. doi: 10.1007/978-1-0716-4690-8_6. Methods Mol Biol. 2025. PMID: 40553329 Review.
-
Revolutionizing surgery: AI and robotics for precision, risk reduction, and innovation.J Robot Surg. 2025 Jan 7;19(1):47. doi: 10.1007/s11701-024-02205-0. J Robot Surg. 2025. PMID: 39776281
-
A deep learning approach to direct immunofluorescence pattern recognition in autoimmune bullous diseases.Br J Dermatol. 2024 Jul 16;191(2):261-266. doi: 10.1093/bjd/ljae142. Br J Dermatol. 2024. PMID: 38581445
Cited by
-
Approaches to modeling cancer metastasis: from bench to bedside.Front Oncol. 2025 Aug 8;15:1602489. doi: 10.3389/fonc.2025.1602489. eCollection 2025. Front Oncol. 2025. PMID: 40860817 Free PMC article. Review.
References
-
- Coons AH, Creech HJ, and Jones RN (1941). Immunological properties of an antibody containing a fluorescent group. P Soc Exp Biol Med 47, 200–202.
-
- Coons AH, Creech HJ, Jones RN, and Berliner E (1942). The demonstration of pneumococcal antigen in tissues by the use of fluorescent antibody. J Immunol 45, 159–170.
-
- Marvin M (1961) Microscopy apparatus. patent application US3013467A.
Publication types
MeSH terms
Grants and funding
LinkOut - more resources
Full Text Sources
Miscellaneous

