. 2025 May 22;53(10):gkaf431.
doi: 10.1093/nar/gkaf431.

SCIG: Machine learning uncovers cell identity genes in single cells by genetic sequence codes

Affiliations

SCIG: Machine learning uncovers cell identity genes in single cells by genetic sequence codes

Kulandaisamy Arulsamy et al. Nucleic Acids Res. .

Abstract

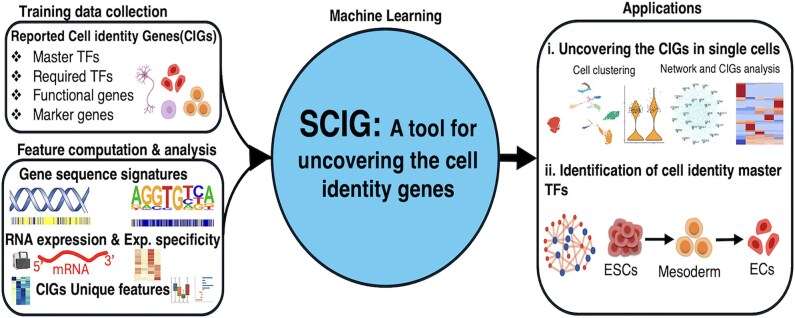
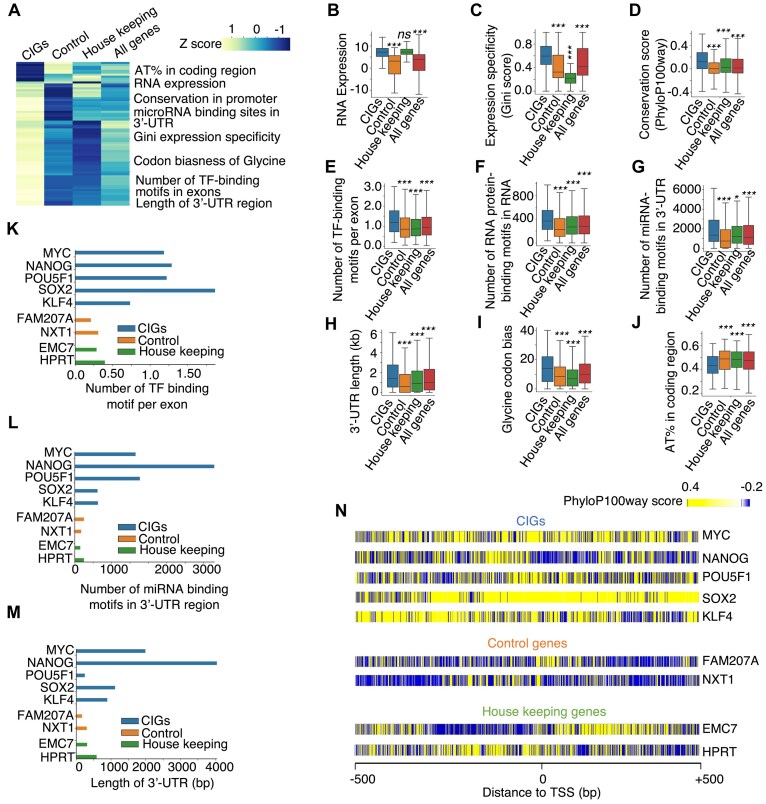
Deciphering cell identity genes is pivotal to understanding cell differentiation, development, and cell identity dysregulation involving diseases. Here, we introduce SCIG, a machine-learning method to uncover cell identity genes in single cells. In alignment with recent reports that cell identity genes (CIGs) are regulated with unique epigenetic signatures, we found CIGs exhibit distinctive genetic sequence signatures, e.g. unique enrichment patterns of cis-regulatory elements. Using these genetic sequence signatures, along with gene expression information from single-cell RNA-seq data, SCIG uncovers the identity genes of a cell without a need for comparison to other cells. CIG score defined by SCIG surpassed expression value in network analysis to reveal the master transcription factors (TFs) regulating cell identity. Applying SCIG to the human endothelial cell atlas revealed that the tissue microenvironment is a critical supplement to master TFs for cell identity refinement. SCIG is publicly available at https://doi.org/10.5281/zenodo.14726426 , offering a valuable tool for advancing cell differentiation, development, and regenerative medicine research.


Conflict of interest statement

None declared.

Figures

Graphical Abstract
Graphical Abstract
Figure 1.
Figure 1.
A systematic survey of genetic sequence signatures and RNA expression features for CIGs. (A) Heatmap illustrating the median values of 73 features that each displayed significant differences between CIGs and either control genes, housekeeping genes, or all human protein-coding genes. The median value of each feature was converted into z-score. (B  –J) Boxplots showing values of represent features in individual gene categories. P-values determined by the two-tailed Wilcoxon test. *P-value < 0.05, ***P-value < 0.001, and ns: nonsignificant. (KM) Bar plots showing genetic sequence feature values of individual embryonic stem CIGs and control or housekeeping genes. (N) Heatmap showing PhyloP100way scores around the TSS of individual embryonic stem CIGs and control or housekeeping genes.
Figure 2.
Figure 2.
SCIG combines genetic sequence signatures with expression information to uncover CIGs in a cell. (A) ROC curve illustrating the performance of SCIG with varying numbers of top features. Performance of the CIGdiscover algorithm that uncovers CIGs by histone modification signatures, gene expression, and expression specificity information is also presented. (B) Bar plot showing feature coefficient of individual genetic sequence signatures or gene expression features used for machine learning in SCIG. (C) Rank plot presenting the CIG scores of individual genes in HUVEC. Red and blue colors indicate CIGs and other genes defined by SCIG, respectively. (D) The CIGs defined by SCIG in HUVEC are enriched with endothelial pathways. (E) Boxplot of regulatory potential scores demonstrating the regulation intensity of individual genes by TFs in HUVEC. (F) Heatmap showing AUROC of SCIG variants trained and tested by individual gene categories. (G) ROC curves depicting the performance of SCIG, and its variants trained with data from varying numbers of cell types. (H) Line plot illustrating the performance of SCIG, and its variants trained with varying subsets of the known CIGs.
Figure 3.
Figure 3.
SCIGNet combines network features of CIGs to uncover master TFs of a cell identity. (A) Heatmap showing Z scores of individual network feature values for individual TF groups. (BE) Box plot illustrating representative network feature values for individual TF groups. ***P-value < 0.001. (FH) Bar plot showing feature values of individual TFs. (I) ROC curves showing the performance of SCIGNet and other methods for uncovering master TFs of cell identity. (J) Bar plot showing feature coefficients of individual network features used by the machine learning models in SCIGNet for uncovering master TFs. (K) Comparison of perturbation scores derived from CellOracle for the cell identity TFs defined by SCIG and CellOracle. (L) Comparison of expression variability for cell identity TFs defined by SCIG and CellOracle. (M) Rank of individual TFs based on the scores calculated by SCIGNet in HUVEC.
Figure 4.
Figure 4.
CIG score outperforms expression value in capturing cell identity in network analysis. (A) Workflow to use SCIG for uncovering CIGs at the single-cell level and perform subsequent applications. (B) Single-cell clustering based on expression and CIG score. (C) Network modules defined using hdWGCNA based on expression and CIG score matrices. (D) Network plot showing the top 25 hub genes in EC identity score- and gene expression-derived network. Expression- and CIG score-specific network hub genes are marked in circles. (E) Ven diagram showing overlap of top 25 hub genes in CIG score- and gene expression-derived networks. (F) Pathway enrichment analysis of CIG score-specific network hub genes. (G) Pathway enrichment analysis of expression-specific network hub genes. CM, cardiomyocytes; EC, endothelial cells; FB, fibroblast; MC, macrophages; MN, monocytes; EB, erythroblast; TC, T cells; NK, natural killer cells; MA, mast cells; PF, proliferating cells; BC, B cells; ME, mesothelial cells.
Figure 5.
Figure 5.
Cell identity score improved single-cell trajectory analysis of neuronal differentiation. (A) Venn diagram showing overlap between highly variable genes defined based on single-cell gene expression and CIG scores. (B) Pathway enrichment analysis of highly variable genes defined based on single-cell gene expression and CIG scores. (C) Expression level and cell identity score of marker genes that we used to define the cell types in this dataset. (D) UMAP displaying cell types and differentiation trajectories in the human forebrain glutamatergic neurogenesis dataset. (E) Barplot showing proportions of individual cell populations clustered based on CIG scores or expression values. (F) Chord diagram showing the cells that are switched between expression- and CIG score-based cell clustering. (G) Heatmaps depicting transition probabilities quantified using CellRank between cell populations clustered based on expression values (left) or CIG scores (right). (H) Projection plots showing the fate probabilities of each cell during the glutamatergic neuron genesis trajectory. RGC1, radial glial cells 1; RGC2, radial glial cells 2; NeuB1, Neuroblast1; NeuB2, Neuroblast2; imneu, immature neurons; Neu1, Neuron 1; Neu2, Neuron 2.
Figure 6.
Figure 6.
SCIG revealed new insight into EC identity fine-tuning by tissue microenvironment. (A) Venn diagram illustrating overlap between the top 10% highly expressed genes and top 10% high-score CIGs identified by SCIG in ECs. (B) Pathway enrichment analysis of the top 10% highly expressed-specific genes and top 10% high-score cell identity specific genes identified by SCIG in ECs. (C) CIG scores for known marker genes of ESC (SOX2, POU5F1), Mesoderm (MIXL1, HAND1), EC-mesenchymal progenitors (FGF1, ZEB2), and endothelial (MECOM, NR2F2) cells during the ESC to EC differentiation process. (D) Heatmap showcasing the identified master TFs of CIGs across different stages of ESC to EC differentiation. (E) Box plot showing Tau score of CIGs and their master TFs uncovered for ECs across 15 tissue types. (F) Heatmap showing the Tau score of endothelial CIGs. (G) Gene-concept network plot displaying pathways enriched in the endothelial CIGs conserved across 15 tissue types. (H) Heatmap showing the Tau score of endothelial master TFs of CIGs. (I) Heatmap showing Tau score of CIGs in each of the four EC subtypes across 15 tissue types. (J) Heatmap showing Tau score of CIG master TFs in each of the four EC subtypes. Data for arterial EC (AEC), venous EC (VEC), capillary EC (CEC) and lymphatic EC (LEC) were presented.

References

    1. Xia B, Zhao D, Wang G et al. Machine learning uncovers cell identity regulator by histone code. Nat Commun. 2020; 11:2696. 10.1038/s41467-020-16539-4. - DOI - PMC - PubMed
    1. Davidson EH, Erwin DH Gene regulatory networks and the evolution of animal body plans. Science. 2006; 311:796–800. 10.1126/science.1113832. - DOI - PubMed
    1. Davidson EH The Regulatory Genome: Gene Regulatory Networks in Development and Evolution. 2006; Academic Press; 10.1016/B978-0-12-088563-3.X5018-4. - DOI
    1. Cahan P, Li H, Morris SA et al. CellNet: network biology applied to stem cell engineering. Cell. 2014; 158:903–15. 10.1016/j.cell.2014.07.020. - DOI - PMC - PubMed
    1. Takahashi K, Yamanaka S Induction of pluripotent stem cells from mouse embryonic and adult fibroblast cultures by defined factors. Cell. 2006; 126:663–76. 10.1016/j.cell.2006.07.024. - DOI - PubMed

Substances

LinkOut - more resources