. 2025 Aug;12(31):e00829.
doi: 10.1002/advs.202500829. Epub 2025 May 28.

Unveiling Formation Pathways of Ternary I-III-VI CuInS2 Quantum Dots and Their Effect on Photoelectrochemical Hydrogen Generation

Affiliations

Unveiling Formation Pathways of Ternary I-III-VI CuInS2 Quantum Dots and Their Effect on Photoelectrochemical Hydrogen Generation

Hyo Cheol Lee et al. Adv Sci (Weinh). 2025 Aug.

Abstract

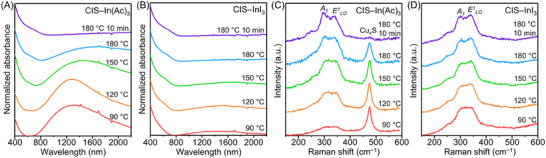
Understanding the formation mechanisms of semiconductor nanocrystal quantum dots (QDs) is essential for fine-tuning their optical and electrical properties. Despite their potential in solar energy conversion, the synthesis processes and resulting properties of ternary I-III-VI QDs remain underexplored due to the complex interplay among their constituent elements. Herein, the formation mechanism of ternary I-III-VI CuInS2 QDs is investigated, and a direct correlation between their synthesis pathways and photoelectrochemical hydrogen generation performance is established. Two distinct formation pathways governed by the Lewis acid strength of the precursors are revealed. Precursors with weaker Lewis acid strength, such as indium acetate-alkylamine complexes, induce the nucleation of Cu x S phases, which subsequently transform into CuInS2 QDs. Conversely, exemplified by indium iodide-alkylamine complexes, precursors with stronger Lewis acid strength enable the simultaneous incorporation of all elements during nucleation, resulting in the direct formation of CuInS2 QDs. Notably, QDs synthesized through this direct pathway exhibit significantly improved electrical properties with lower electron trap densities, resulting in outstanding photoelectrochemical hydrogen production with an excellent photocurrent density of 11.3 mA cm-2 at 0.6 VRHE when used as sensitizers in photoanodes. These findings highlight the critical role of formation pathways in tailoring the properties of ternary I-III-VI QDs.

Keywords: I–III–VI; formation mechanism; hydrogen production; photoelectrochemical properties; quantum dots.


Conflict of interest statement

The authors declare no conflict of interest.

Figures

Figure 1
Figure 1
Synthesis of CIS QDs. A) Schematic illustration depicting two distinct synthesis routes of CIS QDs. Note that the illustrations should be interpreted as conceptual representations of molecular species, not precise depictions of specific structural geometries (e.g., bond lengths, angles between atoms, and ionic radii). B) Absorption spectra of two‐types of CIS QDs. TEM images of CIS QDs synthesized using C) In(Ac)3–OAm and D) InI3–OAm complexes. Each inset shows a high‐resolution TEM image.
Figure 2
Figure 2
In situ X‐ray scattering analysis on the formation of CIS QDs. In situ SAXS patterns depicting the evolution of A) CIS–In(Ac)3 and B) CIS–InI3 QDs. The scattering intensities of panels A and B are plotted using a logarithmic scale. Estimated radius of gyration of intermediates during the synthesis of C) CIS–In(Ac)3 and D) CIS–InI3 QDs. In situ WAXS patterns depicting the evolution of E) CIS–In(Ac)3 and F) CIS–InI3 QDs as a function of reaction time. The representative scattering patterns acquired from G) panel E and H) panel F. Reflections of bulk CuS (JCPDS No. 79–2321) and CuInS2 (JCPDS No. 47–1372) are presented as gray and black bars, respectively. The scattering intensities of panels E–H are plotted using a linear scale. Peak position shifts of I) CuS (102)/CIS (112) and J) CuS (110)/CIS (024) planes as a function of reaction time (corresponding to 6–55 min). In this work, the first recorded in situ SAXS and WAXS patterns at room temperature are denoted as 0 min.
Figure 3
Figure 3
Ex situ absorption and Raman spectroscopy of the formation of CIS QDs. Temporal evolution of absorption spectra during the synthesis of A) CIS–In(Ac)3 and B) CIS–InI3 QDs. Temporal evolution of Raman spectra during the synthesis of C) CIS–In(Ac)3 and D) CIS–InI3 QDs. For ex situ measurements, reaction stages are indicated by temperature and reaction time. For example, the sample labeled “180 °C 10 min” indicates that the synthesis was carried out for 10 min at 180 °C. Samples without a time component (90, 120, 150, and 180 °C) represent the temperatures at which their synthesis was halted during the heating step. This naming convention is used consistently throughout the rest of the paper for ex situ measurements.
Figure 4
Figure 4
X‐ray absorption analysis of the formation of CIS–In(Ac)3 QDs. Cu K‐edge A) experimental k 2‐weighted EXAFS oscillations, B) Fourier‐transformed EXAFS spectra, and C) Fourier‐filtered EXAFS spectra of intermediates during the synthesis of CIS–In(Ac)3 QDs. D) Cu─S amplitude reduction factor (S0 2) and bond length (R, Å), estimated by EXAFS fitting analysis. In K‐edge E) experimental k 2‐weighted EXAFS oscillations, F) Fourier‐transformed EXAFS spectra, and G) Fourier‐filtered EXAFS spectra of intermediates during the synthesis of CIS–In(Ac)3 QDs. H) In─S amplitude reduction factor (S0 2) and bond length (R, Å), estimated by EXAFS fitting analysis. Solid lines represent fitted data, while circled patterns represent experimental data.
Figure 5
Figure 5
Schematic illustration depicting the formation of CIS QDs with two different indium precursors. Red and blue arrows indicate synthesis pathways of CIS–In(Ac)3 and CIS–InI3 QDs, respectively.
Figure 6
Figure 6
Optical and electrical characteristics of CIS QDs. A) Mott–Schottky plot for CIS QDs. Trap density and carrier mobility for B) electron‐only and C) hole‐only devices employing CIS QDs, as calculated from the SCLC plots. D) Time‐resolved photoluminescence curves of CIS−In(Ac)3 and CIS−InI3 QDs. The PL intensity is plotted using a linear scale. Pristine CIS QDs with OAm ligands were utilized for Mott–Schottky and SCLC analyses, without any post‐synthetic ligand treatments.
Figure 7
Figure 7
PEC characteristics of photoanodes utilizing CIS QDs. A) Schematic illustration depicting the energy levels and charge transfer mechanism in PEC devices using CIS QD‐sensitized TiO2 photoanodes. Current–voltage (JV) curves of B) the TiO2/CIS QDs/ZnS and C) the TiO2/CIS QDs/ZnS/SiO2 photoanodes. D) ABPE curves of CIS‐QDs sensitized TiO2 photoanodes measured at 0.6 VRHE applied potential under AM 1.5G illumination. E) IPCE spectra and integrated photocurrent density of the TiO2/CIS QDs/ZnS/SiO2 photoanodes measured at 0.6 VRHE applied potential under AM 1.5G illumination. F) PEC hydrogen evolution amount experimentally measured and calculated, and faradaic efficiency plots of the TiO2/CIS QDs/ZnS/SiO2 photoanodes as a function of time measured at 0.6 VRHE applied potential under AM 1.5G illumination. G) Mott–Schottky plots of the photoanodes. H) Nyquist plots of the photoanodes under AM 1.5G illumination. I) Surface photovoltages of CIS‐QDs sensitized TiO2 photoanodes.

Similar articles

  • Prescription of Controlled Substances: Benefits and Risks.
    Preuss CV, Kalava A, King KC. Preuss CV, et al. 2025 Jul 6. In: StatPearls [Internet]. Treasure Island (FL): StatPearls Publishing; 2025 Jan–. 2025 Jul 6. In: StatPearls [Internet]. Treasure Island (FL): StatPearls Publishing; 2025 Jan–. PMID: 30726003 Free Books & Documents.
  • Management of urinary stones by experts in stone disease (ESD 2025).
    Papatsoris A, Geavlete B, Radavoi GD, Alameedee M, Almusafer M, Ather MH, Budia A, Cumpanas AA, Kiremi MC, Dellis A, Elhowairis M, Galán-Llopis JA, Geavlete P, Guimerà Garcia J, Isern B, Jinga V, Lopez JM, Mainez JA, Mitsogiannis I, Mora Christian J, Moussa M, Multescu R, Oguz Acar Y, Petkova K, Piñero A, Popov E, Ramos Cebrian M, Rascu S, Siener R, Sountoulides P, Stamatelou K, Syed J, Trinchieri A. Papatsoris A, et al. Arch Ital Urol Androl. 2025 Jun 30;97(2):14085. doi: 10.4081/aiua.2025.14085. Epub 2025 Jun 30. Arch Ital Urol Androl. 2025. PMID: 40583613 Review.
  • Elbow Fractures Overview.
    Waseem M, Saeed W, Launico MV. Waseem M, et al. 2025 Jul 7. In: StatPearls [Internet]. Treasure Island (FL): StatPearls Publishing; 2025 Jan–. 2025 Jul 7. In: StatPearls [Internet]. Treasure Island (FL): StatPearls Publishing; 2025 Jan–. PMID: 28723005 Free Books & Documents.
  • Electrophoresis.
    Sonagra AD, Zubair M, Dholariya SJ. Sonagra AD, et al. 2025 Jul 14. In: StatPearls [Internet]. Treasure Island (FL): StatPearls Publishing; 2025 Jan–. 2025 Jul 14. In: StatPearls [Internet]. Treasure Island (FL): StatPearls Publishing; 2025 Jan–. PMID: 36251838 Free Books & Documents.
  • The Black Book of Psychotropic Dosing and Monitoring.
    DeBattista C, Schatzberg AF. DeBattista C, et al. Psychopharmacol Bull. 2024 Jul 8;54(3):8-59. Psychopharmacol Bull. 2024. PMID: 38993656 Free PMC article. Review.

References

    1. Murray C. B., Norris D. J., Bawendi M. G., J. Am. Chem. Soc. 1993, 115, 8706.
    1. Gu F., Guo W., Yuan Y., Deng Y.‐P., Jin H., Wang J., Chen Z., Pan S., Chen Y., Wang S., Adv. Mater. 2024, 36, 2313096. - PubMed
    1. Ma A., Lee Y., Seo D., Kim J., Park S., Son J., Kwon W., Nam D.‐H., Lee H., Kim Y.‐I., Um H.‐D., Shin H., Nam K. M., Adv. Sci. 2024, 11, 2400874. - PMC - PubMed
    1. Dong W. J., Ye Z., Tang S., Navid I. A., Xiao Y., Zhang B., Pan Y., Mi Z., Adv. Sci. 2024, 11, 2309548. - PMC - PubMed
    1. Choi H., Seo S., Yoon C. J., Ahn J.‐B., Kim C.‐S., Jung Y., Kim Y., Toma F. M., Kim H., Lee S., Adv. Sci. 2023, 10, 2303106 - PMC - PubMed

LinkOut - more resources