. 2025 Jun 17;99(6):e0046925.
doi: 10.1128/jvi.00469-25. Epub 2025 May 28.

Contrasting interferon-mediated antiviral responses in human lung adenocarcinoma cells

Affiliations

Contrasting interferon-mediated antiviral responses in human lung adenocarcinoma cells

Matthew Esparza et al. J Virol. .

Abstract

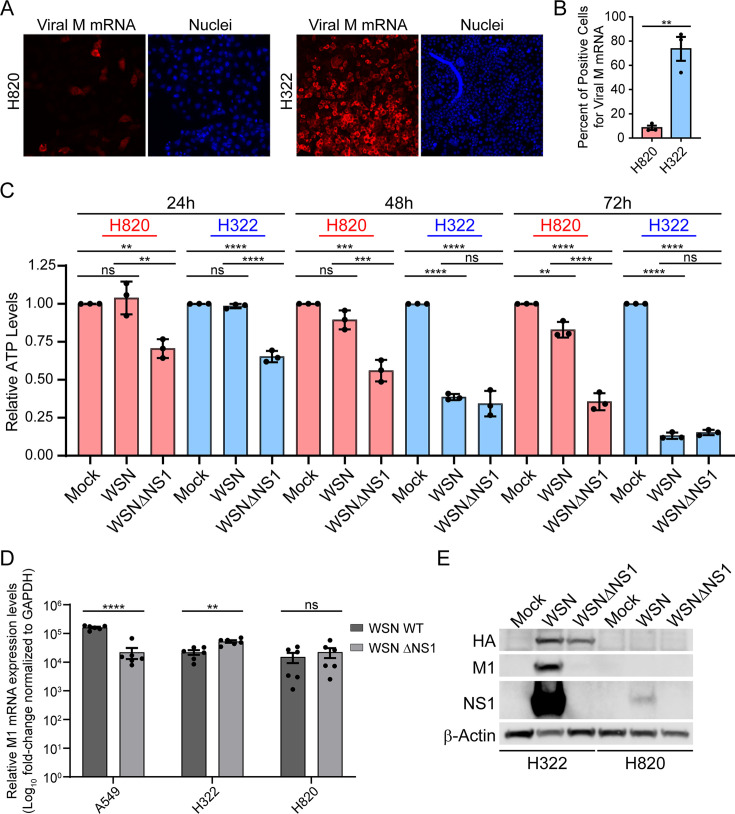
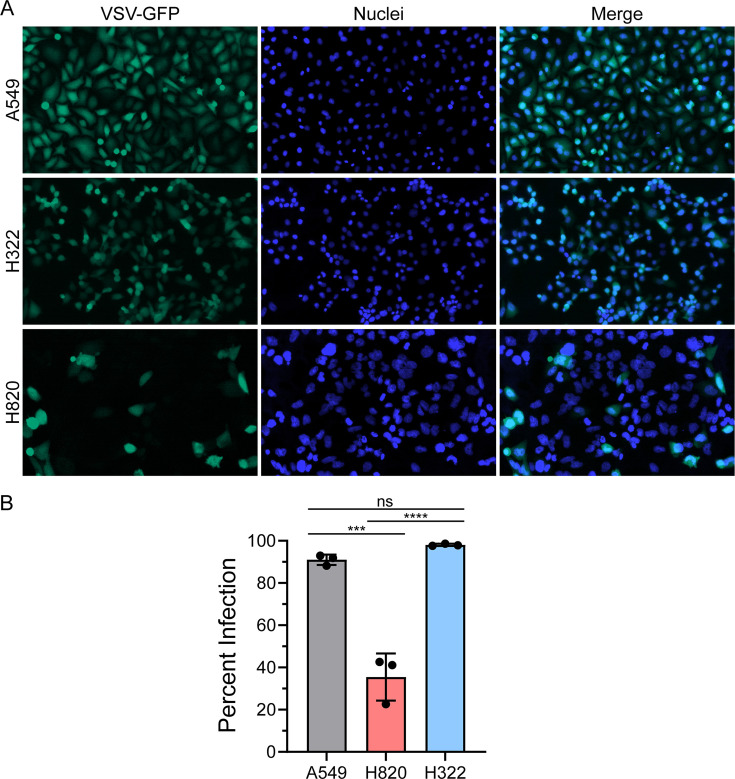
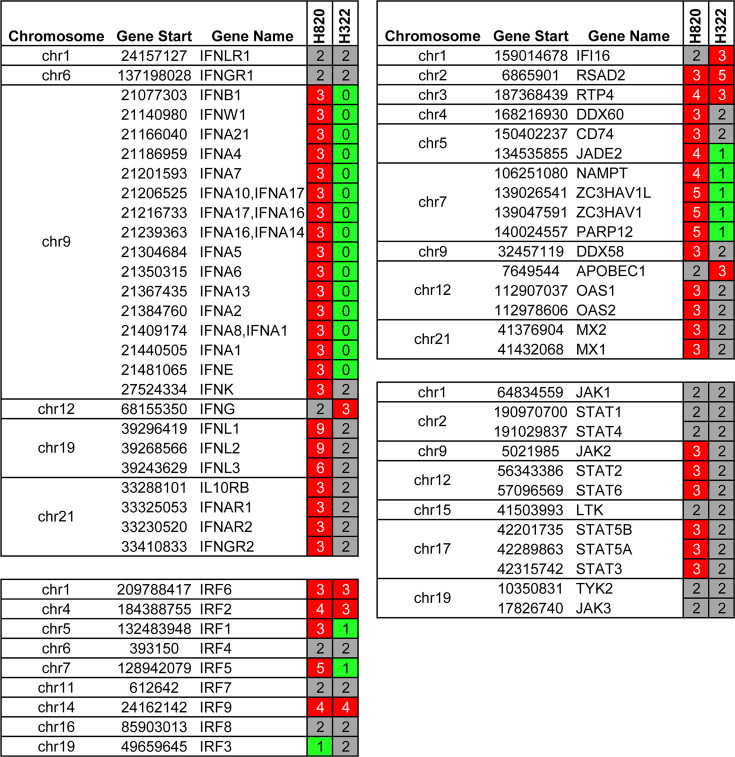
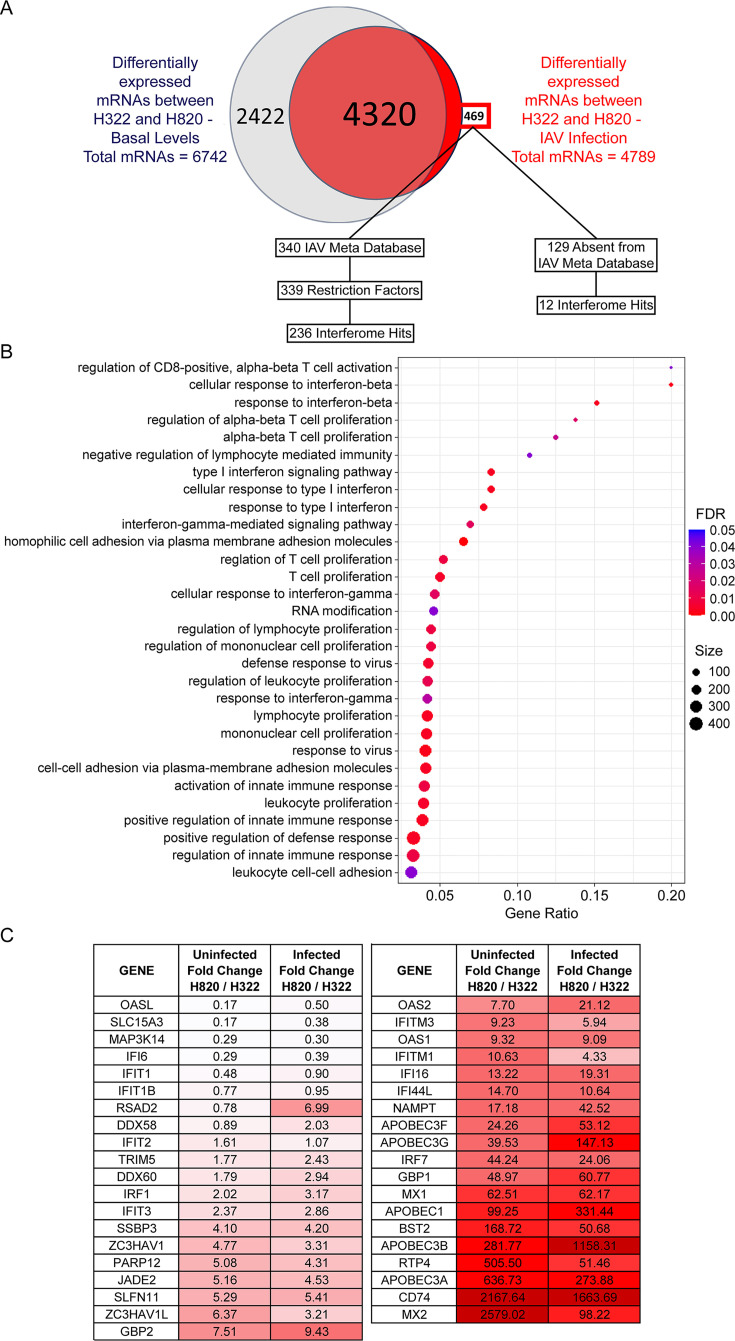
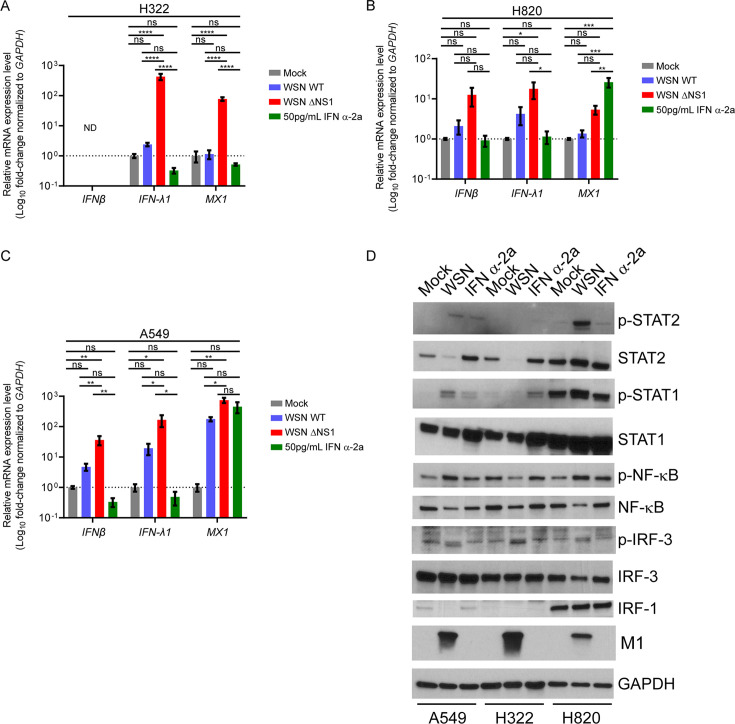
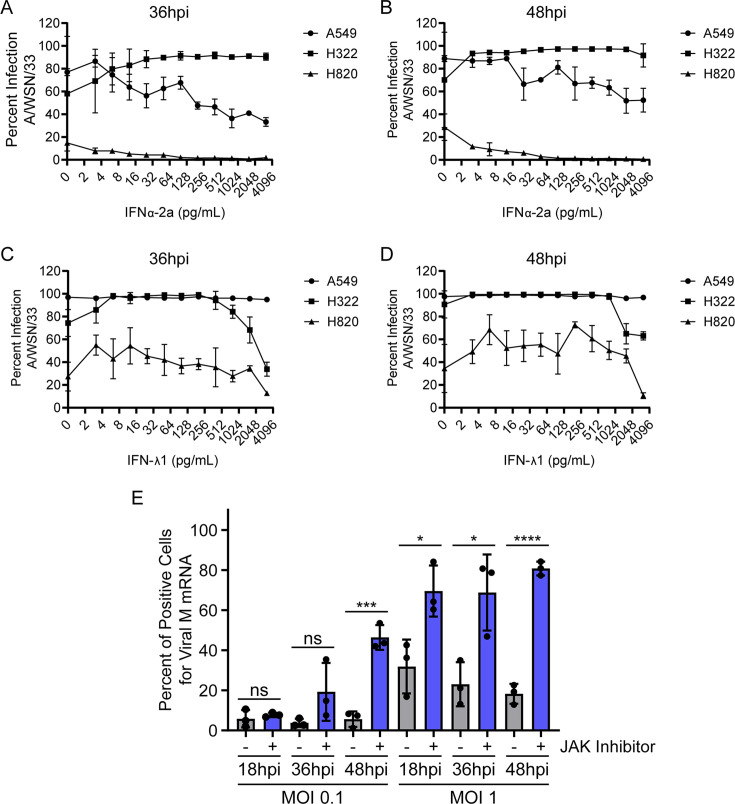
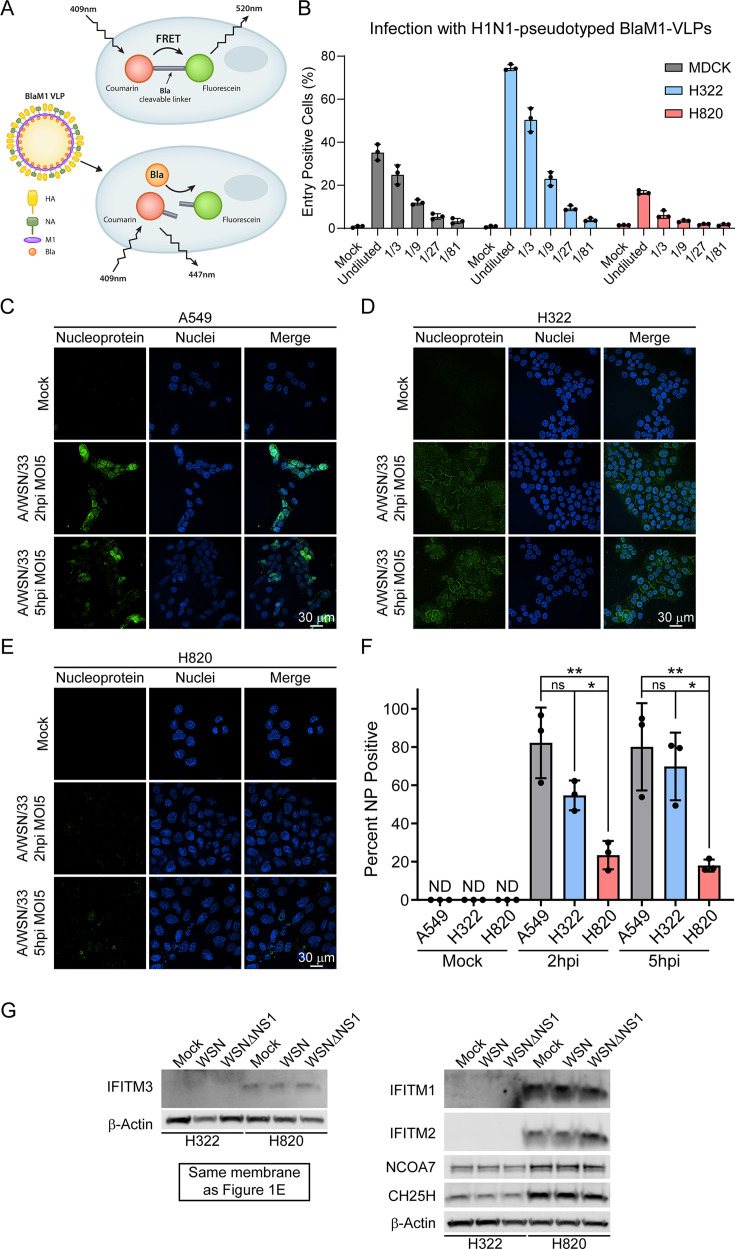
Lung cancers develop from lung epithelial cells after a series of genetic and epigenetic changes, and these cells are major sites of influenza virus infection. Thus, we explored how changes found in patient-derived lung cancer cell lines impacted influenza virus replication and identified two lines with opposite responses to influenza A viral infection. We show that the NCI-H820 lung adenocarcinoma (LUAD) is resistant to influenza A virus and VSV infection, while LUAD line NCI-H322 is highly susceptible to infection by both viruses. H322 cells have a homozygous deletion in a region of chromosome 9 encoding IFNαgenes, IFNβ1, IFNω1, and IFNε genes, leading to downregulation of immune response and high infection rates. In contrast, the resistant H820 cell line has three copies of these same interferon genes and shows increased expression of interferon-regulated genes. We found that the resistance of H820 cells to influenza infection is likely linked to impaired viral entry-due to high basal levels of interferon-induced proteins known to inhibit endocytosis (IFITM1/2/3, NCOA7, and CH25H)-and to increased expression of mRNAs that encode other antiviral factors. In contrast, H322 cells show the absence or low levels of interferon-regulated genes involved in the inhibition of viral entry. These results suggest that the opposite phenotypes on viral entry of H322 and H820 cells may be at least in part associated with impaired or enhanced interferon response, respectively. Since most lung cancer patients have genomic characterization of their tumors, individualized differences in interferon responses may have therapeutic and patient management implications.

Importance: Lung cancers develop from genetic and epigenetic changes that can dramatically influence patients' susceptibility to viral infection and replication. This study evaluates the responses to influenza virus infection of two patient-derived lung cancer cell lines. Interestingly, the cell lines investigated are of the same cancer type, lung adenocarcinomas, yet one cell line is highly susceptible, while the other cell line is highly resistant to viral infection. This is in part due to contrasting genetic alterations that lead to changes in the interferon response pathways, which differentially impact viral entry. Thus, identifying these risk factors can inform the prognosis of patients infected with influenza virus and guide their personalized treatment plans.

Keywords: influenza; interferons; lung cancer; viral entry.


Conflict of interest statement

The A.G.-S. laboratory has received research support from GSK, Pfizer, Senhwa Biosciences, Kenall Manufacturing, Blade Therapeutics, Avimex, Johnson and Johnson, Dynavax, 7Hills Pharma, Pharmamar, ImmunityBio, Accurius, Nanocomposix, Hexamer, N-fold LLC, Model Medicines, Atea Pharma, Applied Biological Laboratories, and Merck, outside of the reported work. A.G.-S. has consulting agreements for the following companies involving cash and/or stock: Castlevax, Amovir, Vivaldi Biosciences, Contrafect, 7Hills Pharma, Avimex, Pagoda, Accurius, Esperovax, Applied Biological Laboratories, Pharmamar, CureLab Oncology, CureLab Veterinary, Synairgen, Paratus, Pfizer, and Prosetta, outside of the reported work. A.G.-S. has been an invited speaker in meeting events organized by Seqirus, Janssen, Abbott, Astrazeneca, and Novavax. A.G.-S. is the inventor on patents and patent applications on the use of antivirals and vaccines for the treatment and prevention of virus infections and cancer, owned by the Icahn School of Medicine at Mount Sinai, New York, outside of the reported work.

Figures

Fig 1
Fig 1
Human lung cancer cells H820 (resistant) and H322 (sensitive) show opposite responses to Influenza A virus infection. (A) smRNA-FISH images depicting H322 and H820 cell lines infected with influenza virus (A/WSN/33) at a multiplicity of infection (MOI) of 2 for 8 h. (B) Percent of cells stained for viral M mRNAs was determined by smRNA-FISH in the images shown in (A). (C) H820 or H322 cell lines were infected with wild-type influenza virus (A/WSN/33) or mutant A/WSN/33 ΔNS1 virus. Cells were infected at MOI of 0.1 for 24 h, 48 h, or 72 h. ATP levels were measured using Cell Titer Glo. (D) A549, H322, or H820 cells were infected with influenza virus at MOI of 1 for 16 h. Purified RNA from these cells was subjected to quantitative PCR (qPCR) to determine viral M mRNA levels, which were expressed relative to GAPDH levels in the respective cells. These conditions show similar levels of infection for each cell type—comparing A/WSN/33 vs A/WSN/33ΔNS1 viruses. (E) Cell extracts from H322 and H820 cell lines mock infected, infected with wild-type A/WSN/33, or infected with the mutant A/WSN/33ΔNS1 virus at MOI of 2 for 8 h were subjected to western blot analysis to detect the viral proteins HA, M1, and NS1. β-Actin is used as a loading control. Graphs show data points and mean ± SD (B and C) or mean ± SEM (D). ns, not significant, **P < 0.01; ***P < 0.001; ****P < 0.0001. In panels (B and D) P values were calculated using unpaired two-tailed Student’s t test. In panel (C), P values were calculated using Tukey’s (one-way analysis of variance [ANOVA]) multiple comparisons.
Fig 2
Fig 2
H820 cells are resistant to VSV infection while H322 cells are sensitive. (A) Immunofluorescence microscopy detected GFP protein in A549, H322, and H820 cell lines infected with VSV-GFP at a multiplicity of infection (MOI) of 0.1 for 8 h. (B) Percent infection was determined by the number of cells positive for GFP in (A). The Graph shows data points and mean ± SD. ns, not significant; ***P < 0.001; ****P < 0.0001. P values were calculated using Tukey’s (one-way ANOVA) multiple comparisons.
Fig 3
Fig 3
Influenza A virus and VSV susceptible cell line (H322) have the deletion of IFN genes, while the resistance cell line (H820) has an amplification of IFN genes and other genes in the IFN pathway. The table shows copy number variation (CNV) data of the indicated chromosomes from H322 and H820 cell lines. The table shows gene deletions highlighted in green and amplifications highlighted in red.
Fig 4
Fig 4
RNAseq analysis of H322 and H820 cells in the absence of infection or upon infection with influenza virus. (A) Venn diagram shows the number of mRNAs that are differentially expressed between H820 and H322 cells at basal levels or upon infection with influenza virus at a multiplicity of infection (MOI) of 1 for 8 h. These include mRNAs that are exclusively expressed in either one of these cell lines. Hits that were differentially expressed exclusively during infection were further compared to the Interferome and IAV Meta Database. (B) Graph of ORA for RNAs upregulated in H820 cells compared to H322 cells upon infection with A/WSN/33 (WSN) at MOI of 1 for 8 h. Each dot represents a pathway that is upregulated in H820 cells, where the size of the dot indicates the number of RNAs that contribute to that pathway, and the color represents the false discovery rate (FDR). Gene ratio represents the Log2-fold change difference between H820 over H322 cells. (C) Examples of ISGs differentially expressed in H820 cells compared to H322 cells in non-infected and/or infected conditions. Fold change between these cell lines is shown.
Fig 5
Fig 5
H322 cells do not upregulate IFNα and β genes upon viral infection, while H820 cells induce IFN. H322 (A), H820 (B), or A549 (C) cells were infected with A/WSN/33 or A/WSN/33ΔNS1 at a multiplicity of infection (MOI) of 1 for 18 h or treated with IFNα-2a for 18 h. RNA was purified from each cell line and subjected to qPCR to determine the levels of IFNβ, IFN-λ1, and MX1 mRNAs. Bars represent mRNA levels relative to GAPDH. (D) Cells were either mock-infected and mock-treated, infected with A/WSN/33 at an MOI of 1, or treated with 50 pg/mL of IFN α-2a and then subjected to western blot analysis to detect p-STAT2, STAT2, p-STAT1, STAT1, p-NF-κB, NF-κB, p-IRF-3, IRF-3, IRF-1, and M1 proteins. GAPDH is used as a loading control. Graphs show means ± SEM. ND = not detected, ns = not significant, *P < 0.05; **P < 0.01; ***P < 0.001; ****P < 0.0001. P values were calculated using Tukey’s (one-way ANOVA) multiple comparisons.
Fig 6
Fig 6
Interferon response is lacking in the highly IAV-susceptible cell line (H322), while the resistant H820 cell line remains responsive. (A and B) A549, H322, and H820 cells were infected with A/WSN/33 at 0.1 multiplicity of infection (MOI), and percent infection was determined in the presence of increasing concentrations of human interferon-α2a at 36 hpi (A) or 48 hpi (B). Interferon treatment started at the time of infection. (C and D) A549, H322, and H820 cells were infected with A/WSN/33 at 0.1 MOI, and percent infection was determined in the presence of increasing concentrations of human interferon-λ1 at 36 hpi (C) or 48 hpi (D). Interferon treatment started at the time of infection. Graphs show mean ± SD. (E) H820 cells were treated with dimethyl sulfoxide (DMSO) (control) or with 10 µM ruxolitinib (JAK inhibitor) for 1 h and then infected with A/WSN/33 for 18 h, 36 h, and 48 h followed by smRNA-FISH to detect viral M mRNA. The percentage of positive cells for M mRNA was determined. Data points, mean, and SD are shown. ns = not significant, *P < 0.05, ***P < 0.001, and ****P < 0.0001. P values were calculated using unpaired two-tailed Student’s t test.
Fig 7
Fig 7
Influenza virus entry is impaired in cell line resistant to viral infection (H820) and not in the highly susceptible cell line (H322). (A) Diagram of BlaM1-VLPs entry assay. VLPs consist of viral proteins HA, NA, and M1 from the A/WSN/33 viral strain, with M1 fused to beta-lactamase (Bla) protein. Cells are incubated with the BlaM1-VLPs, then with a fluorescent substrate (CCF2-AM) consisting of Coumarin and Fluorescein linked by a linker cleavable by Bla. In cells that were not infected with the BlaM1-VLP, excitation at 409 nm results in fluorescence resonance energy transfer (FRET) occurring between Coumarin and Fluorescein, resulting in Fluorescein emitting at 520 nm. In cells infected with the BlaM1-VLP, Bla is present to cleave the Coumarin and Fluorescein. When excitation occurs at 409 nm, there is no FRET, and only Coumarin emits at 447 nm. This difference in excitation is used to determine if cells are positive for BlaM1-VLP entry. (B) MDCK, H322, or H820 cells were incubated with BlaM1-VLPs, the substrate was added, and Bla activity was measured by flow cytometry. Various VLP dilutions were used as indicated in the x-axis. Each bar represents the percent positive cells from 10,000 live cells. Data represent three independent experiments. (C–E) Representative images of synchronized viral entry in A549 (C), H322 (D), and H820 (E) cell lines infected with A/WSN/33 at a multiplicity of infection (MOI) of 5 after 2 hpi or 5 hpi. NP protein (green) present in nuclei (blue) was counted as positive for viral entry. (F) Graphs show the percentage of NP-positive cells. Bars represent means ± SD, and each point represents the percentage of a single replicate, n = 3. ns, not significant; *P < 0.05; **P < 0.01. P values were calculated using Tukey’s (one-way ANOVA) multiple comparisons. (G) Cell extracts from H322 and H820 cells were mock infected, infected with wild-type A/WSN/33, or infected with A/WSN/33 ΔNS1 at MOI of 2 for 8 h and then subjected to western blot analysis to detect IFITM1/2/3, NCOA7, and CH25H proteins. Cell lysates are the same as in Fig. 1E. IFITM3 and β-Actin were probed in the same membrane shown in Fig. 1E. The other proteins were probed using a different membrane. n = 3. β-Actin is used as a loading control.

Similar articles

References

    1. Kinslow CJ, Wang Y, Liu Y, Zuev KM, Wang TJC, Donalek CM, Amori M, Cheng S. 2019. Influenza and mortality for non-small cell lung cancer. JCO 37:e13114. doi: 10.1200/JCO.2019.37.15_suppl.e13114 - DOI - PMC - PubMed
    1. Keeler SP, Agapov EV, Hinojosa ME, Letvin AN, Wu K, Holtzman MJ. 2018. Influenza A virus infection causes chronic lung disease linked to sites of active viral RNA remnants. J Immunol 201:2354–2368. doi: 10.4049/jimmunol.1800671 - DOI - PMC - PubMed
    1. Weng CF, Chen LJ, Lin CW, Chen HM, Lee HC, Ling TY, Hsiao FY. 2019. Association between the risk of lung cancer and influenza: a population-based nested case-control study. Int J Infect Dis 88:8–13. doi: 10.1016/j.ijid.2019.07.030 - DOI - PubMed
    1. Chatterjee S, Crozet L, Damotte D, Iribarren K, Schramm C, Alifano M, Lupo A, Cherfils-Vicini J, Goc J, Katsahian S, Younes M, Dieu-Nosjean MC, Fridman WH, Sautès-Fridman C, Cremer I. 2014. TLR7 promotes tumor progression, chemotherapy resistance, and poor clinical outcomes in non-small cell lung cancer. Cancer Res 74:5008–5018. doi: 10.1158/0008-5472.CAN-13-2698 - DOI - PubMed
    1. Zhao H, Wu L, Yan G, Chen Y, Zhou M, Wu Y, Li Y. 2021. Inflammation and tumor progression: signaling pathways and targeted intervention. Signal Transduct Target Ther 6:263. doi: 10.1038/s41392-021-00658-5 - DOI - PMC - PubMed

LinkOut - more resources