. 2025 May 1;66(5):42.
doi: 10.1167/iovs.66.5.42.

Clofarabine Enhances the Transduction Efficiency of Recombinant AAV2 in the Retina

Affiliations

Clofarabine Enhances the Transduction Efficiency of Recombinant AAV2 in the Retina

Yuyao Diao et al. Invest Ophthalmol Vis Sci. .

Abstract

Purpose: Ribonucleotide reductase inhibitors, a class of antineoplastic agents, were investigated for their ability to enhance recombinant adeno-associated virus serotype 2 (rAAV2) transduction in the mouse retina and their underlying mechanisms.

Methods: Candidate ribonucleotide reductase inhibitors were screened in ARPE-19 cells to identify concentrations preserving cell viability while optimizing rAAV2 transduction. Clofarabine, which demonstrated superior enhancement of rAAV2 in vitro, was selected for in vivo evaluation via subretinal coadministration with rAAV2.GFP in mice. Transcriptomic mechanisms were dissected using RNA sequencing (RNA-seq) of clofarabine-treated ARPE-19 cells and single-cell RNA-seq of murine retinas after combinatorial treatment.

Results: Cellular viability assays demonstrated that clofarabine pretreatment significantly enhanced rAAV2.GFP transgene expression in ARPE-19 cells, elevating both mRNA and protein levels compared with rAAV2.GFP transduction alone. This enhancement was mirrored in vivo, where subretinal coadministration of clofarabine with rAAV2.GFP in mice increased retinal transduction efficiency markedly, without detectable toxicity. Transcriptomic profiling delineated clofarabine's mechanism. (1) In proliferating cells, it triggered S-phase arrest by upregulating CCNE2 and CDC6, synchronizing cell populations to optimize viral genome processing; and (2) in postmitotic retinal cells, it suppressed innate immune pathways while enhancing nucleotide biosynthesis and transcriptional activity, thereby creating a microenvironment permissive to rAAV transduction.

Conclusions: Clofarabine safely enhances rAAV2 transduction efficiency in both ocular cell models and murine retinas. Its ability to synchronize cell cycles in dividing cells and reprogram transcriptional landscapes in postmitotic cells positions it as a promising adjunct for rAAV-based ocular gene therapy, potentially decreasing therapeutic vector doses and improving clinical outcomes.


Conflict of interest statement

Disclosure: Y. Diao, None; X. Xiong, None; J, Liu, None; X. Teng, None; Q. Shi, None; S, Jin, None; Y. Lei, None; S. Ma, None; G.-S. Liu, None; L. Liu, None; G. Yu, None; J.-H. Wang, None; J. Zhong, None; L. Tu, None

Figures

Figure 1.
Figure 1.
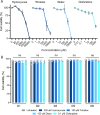
Identification of optimal concentration of different RNR inhibitors that maintains viability of ARPE-19 cells. (A) Cell viability was measured by CCK-8 in ARPE19 cells treated with various RNR inhibitors at different concentrations for 24 hours, followed by regular culture for 6 days. Hydroxyurea (Hyd) at 0.2 mM, Trimidox (Tri) at 100 µM, Didox (Did) at 100 µM, and clofarabine (Clo) at 0.1 µM showed no significant impact on the viability of ARPE-19 cells (P > 0.5). (B) The apoptotic rate of ARPE-19 cells was detected at day 1 (D1), day 2 (D2), day 3 (D3), day 5 (D5), and day 8 (D8) after the addition of RNR inhibitor. Cell survival rate was not significantly changed after the addition of different RNR inhibitors at multiple timepoints. All bar graphs are presented as mean ± SD. ns, not significant. Statistical analysis was performed by ANOVA test.
Figure 2.
Figure 2.
RNR inhibitors can effectively improve the transduction efficiency of rAAV2 in vitro. (A) A schematic diagram of RNR inhibitors treating ARPE 19 cells with rAAV2.GFP. ARPE-19 cells were treated with 200 µM hydroxyurea, 100 µM trimidox, 100 µM didox, and 0.1 µM clofarabine for 24 hours before infection by AAV2 for 48 hours. (B) Cells were imaged under a fluorescence microscope at day 2, day 4, and day 7 post infection to assess the GFP expression. Green indicates expression of GFP (scale bar, 100 µm). (C) Quantitative analysis GFP-positive area in the retina treated with different combinations. (D) GFP expression was assessed by Western blot in ARPE-19 cells treated with different combinations for 2 days, 4 days, and 7 days. Control group indicates the ARPE-19 cells without any treatment. (E) Flow cytometry was used to quantify the expression of GFP in cells under the same treatment condition as those in (C). (F) The mRNA expression of GFP in ARPE-19 cells under the same treatment combination as panel C. All data are presented as mean ± SD. ns, not significant. Statistical analysis was performed by ANOVA test.
Figure 3.
Figure 3.
Clofarabine can effectively improve the transduction efficiency of rAAV2 in mouse retina. (A) Representative images of the retinal flat mount (n ≥ 3) 2 weeks after subretinal injection of rAAV2-GFP or rAAV2-GFP with 0.1 µM or 0.5 µM clofarabine. Green indicates GFP expression, and blue indicates DAPI. Scale bar, 100 µm. (B) Quantitative analysis of GFP-positive area in the mouse retina. (C and D) The GFP expression level in the retina and the RPE–choroid layer of mice (5 retinas pooled) was detected by Western blot 4 weeks after subretinal injection of different combinations. All bar graphs are presented as mean ± SD. ns, not significant. Statistical analysis was performed by ANOVA test.
Figure 4.
Figure 4.
Clofarabine effectively increases the distribution and transduction of AAV2 in the mouse retina. (A) Representative images showing GFP expression distribution in retinal sections (n = 4) 2 weeks after subretinal injection of rAAV2-GFP, rAAV2-GFP with 0.1 µM clofarabine, or rAAV2-GFP with 0.5 µM clofarabine. Green indicates GFP expression, and blue indicates DAPI. Scar bar, 500 µm. (B) Quantitative analysis of GFP-positive areas in the retinal sections of mice receiving different vectors. (C and D) Enlarged images showing GFP expression in the RPE and photoreceptors from eyes treated with different vectors. (E) H&E staining to observe retinal structural changes at 4 weeks post injection. (F) TUNEL assay performed on mouse retinas 2 weeks post injection with various vectors. No obvious cell death were observed in mice retina receiving different vectors. Scale bar, 50 µm. All bar graphs are presented as mean ± SD. Statistical analysis was performed using ANOVA.
Figure 5.
Figure 5.
Clofarabine along with AAV vectors results in cell cycle arrest at the S phase. (A) RNA-seq revealed 1094 DEGs in cells treated with both clofarabine and rAAV2.GFP compared with cells treated with rAAV2.GFP alone. (B) GO enrichment analysis of the DEGs suggested that clofarabine affects viral transduction mainly through affecting biological processes involving cell cycle and DNA synthesis, such as nuclear division and DNA replication. (C) Quantitative analysis of cell cycle of ARPE-19 cell treated with clofarabine for 5 days and 8 days suggested that clofarabine enhances rAAV transduction potentially via S phase arrest. All bar graphs are presented as mean ± SD. ns, not significant. Statistical analysis was performed by ANOVA test.
Figure 6.
Figure 6.
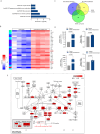
Clofarabine enhances rAAV transduction via regulating CCNE2 and CDC6. (A) Pathway analysis of DEGs identified above using the KEGG pathway database. (B) A heatmap of DEGs included in the cell-cycle pathway clearly illustrated the upregulated expression of these DEGs in cells exposed to clofarabine. (C) Overlapped genes identified in the nuclear division, DNA replication, and cell cycle and resulted in two genes, CDC6 and CCNE2. (D) Quantitative PCR analysis revealed that the overexpression of CDC6 and CCNE2 alone led to a significant increase in GFP expression by 0.16 ± 0.01-fold and 0.26 ± 0.10-fold, respectively (n = 3–4 biological replicates in each group). (E) Both CDC6 and CCNE2 are upregulated and involved in S phase in the cell-cycle pathway in cells exposed to both rAAV2.GFP and clofarabine. Diagrams was plotted using pathview. All bar graphs are presented as mean ± SD, ns, not significant. Statistical analysis was performed by ANOVA test. (E) The mechanism of clofarabine on the cell cycle was mapped according to KEGG analysis, with red representing upregulated genes and blue representing genes related to apoptosis.
Figure 7.
Figure 7.
The effects of clofarabine on mouse retina evaluated by single-cell sequencing. (A) t-Distributed stochastic neighbor embedding (t-SNE) plot showing the distribution of different retinal cell types. (B) The expression of selected cell-type-specific marker genes in violin plots. (C) Heatmaps showing GO terms enriched for the upregulated (left) and downregulated (right) rescue DEGs of different neuronal cell types after clofarabine treatment.

Similar articles

References

    1. Duncan JL, Pierce EA, Laster AM, et al. .. Inherited retinal degenerations: current landscape and knowledge gaps. Transl Vis Sci Technol. 2018; 7: 6. - PMC - PubMed
    1. Wang D, Tai PWL, Gao G.. Adeno-associated virus vector as a platform for gene therapy delivery. Nat Rev Drug Discov. 2019; 18: 358–378. - PMC - PubMed
    1. Kaplitt MG, Feigin A, Tang C, et al. .. Safety and tolerability of gene therapy with an adeno-associated virus (AAV) borne GAD gene for Parkinson's disease: an open label, phase I trial. Lancet (London, England). 2007; 369: 2097–2105. - PubMed
    1. Xu ZJ, Jia YL, Wang M, et al. .. Effect of promoter, promoter mutation and enhancer on transgene expression mediated by episomal vectors in transfected HEK293, Chang liver and primary cells. Bioengineered. 2019; 10: 548–560. - PMC - PubMed
    1. Weinberg MS, Nicolson S, Bhatt AP, McLendon M, Li C, Samulski RJ.. Recombinant adeno-associated virus utilizes cell-specific infectious entry mechanisms. J Virol. 2014; 88: 12472–12484. - PMC - PubMed

Supplementary concepts

LinkOut - more resources