. 2025 May 1;14(5):31.
doi: 10.1167/tvst.14.5.31.

Novel Artificial Intelligence-Based Quantification of Anterior Chamber Inflammation Using Vision Transformers

Affiliations

Novel Artificial Intelligence-Based Quantification of Anterior Chamber Inflammation Using Vision Transformers

Carlos Cifuentes-González et al. Transl Vis Sci Technol. .

Abstract

Purpose: Quantitative assessment of inflammation is critical for the accurate diagnosis and effective management of uveitis. This study aims to introduce a novel three-dimensional vision transformer approach using anterior segment optical coherence tomography (AS-OCT) to quantify anterior chamber (AC) inflammation in uveitis patients.

Methods: This cross-sectional study was conducted from January 2022 to December 2023 at a single tertiary eye center in Singapore, analyzing 830 AS-OCT B-scans from 180 participants, including uveitis patients at various stages of inflammation and healthy controls. The primary outcomes measured were central corneal thickness (CCT), Iris Vascularity Index (IVI), and Anterior Chamber Particle Index (ACPI). These parameters were assessed using the Swin Transformer V2 artificial intelligence algorithm on AS-OCT images.

Results: The study included 180 participants, including uveitis patients and healthy controls. We observed significant differences between these groups in CCT (P = 0.01), ACPI (P < 0.001), and IVI (P < 0.001). Affected eyes showed elevated CCT and ACPI, along with a significant decrease in IVI, especially in severe inflammation cases. Linear regression analysis underscored a robust correlation between these biometric parameters and inflammation severity in the AC (R = 0.481, P < 0.001). A 6-month longitudinal study further validated the stability and repeatability of these measurements, affirming their reliability over time.

Conclusions: This study introduces a novel, objective method to quantify ocular inflammation using ACPI, IVI, and CCT, which enhances the precision of assessments over traditional subjective methods prone to interobserver variability. Demonstrated through significant biomarker stability over a 6-month period, our findings support the use of these metrics for reliable long-term monitoring of inflammation progression and treatment efficacy in clinical practice.

Translational relevance: Our artificial intelligence algorithm objectively quantifies AC inflammation reliably over the time and could be used in the clinic as well as in clinical trials as an objective biomarker.


Conflict of interest statement

Disclosure: C. Cifuentes-González, None; L. Gutiérrez-Sinisterra, None; W. Rojas-Carabali, None; J. Boon, None; A. Hudlikar, None; X. Wei, None; L. Shchurov, None; H.H. Oo, None; N.C. Loh, None; C.S. Shannon, None; L.D. Rodríguez-Camelo, None; B. Lee None; A. de-la-Torre, None; R. Agrawal, None

Figures

Figure 1.
Figure 1.
Features of the Images and the Platform Analysis. (A) Examples of different types of images from patients with AC inflammation, contralateral eyes of patients with uveitis, and healthy eyes used in this model. (B) The different layers automatically generated by the Visual Transformers system and what it segments in patients with AC inflammation.
Figure 2.
Figure 2.
Analysis by eye, etiology, and location of inflammation. Results of the tool's analysis based on one-way analysis of variance or Kruskal–Wallis tests and post hoc tests adjusted by Holm's test for the comparison of numerical variables, with the selection of the test depending on the data distribution. (A) Differences found when analyzing CCT, ACPI, and IVI, with results divided into eyes with uveitis, contralateral eyes of patients with uveitis, and healthy control eyes. (B) Results of the same measurements in the AC for patients with uveitis, categorized by infectious, noninfectious, and idiopathic etiologies. (C) Distribution of the data for the same measurements, but for patients with uveitis divided by the anatomical location of the inflammation (anterior, intermediate, posterior, and panuveitis). Significant differences are highlighted with asterisks (*P < 0.05, **P < 0.01, ***P < 0.001).
Figure 3.
Figure 3.
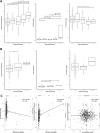
Analysis by cell grading and flare grading, and correlation between measurements. Results of the tool's analysis based on one-way analysis of variance or Kruskal–Wallis tests and post hoc tests adjusted by Holm's test for the comparison of numerical variables, with the selection of the test depending on the data distribution. (A) Results of CCT, ACPI, and IVI for patients with uveitis, divided by different grades of AC inflammation based on the SUN classification. (B) Results based on the degree of flare in the AC, also according to the SUN classification. (C) Correlation between all measurements, with all correlations performed using Spearman's test owing to the data distribution. Significant differences are highlighted with asterisks (*P < 0.05, **P < 0.01, ***P < 0.001).
Figure 4.
Figure 4.
Receiver operating characteristic curves demonstrating the diagnostic performance of CCT, ACPI, and IVI. (A) Multiclass receiver operating characteristic curves for cell categories. Receiver operating characteristic curves for different levels of cell presence using CCT, ACPI, and IVI as diagnostic tools. Blue curve: No cells (AUC = 0.69); Orange curve: 0.5–1+ cells (AUC = 0.57); Green curve: 2–4+ cells (AUC = 0.78). (B) Receiver operating characteristic curves for different cell levels vs no cells. Performance of CCT, ACPI, and IVI in distinguishing varying levels of cell presence from no cells. Red curve: CCT for 2–4+ cells vs no cells (AUC = 0.78); Orange curve: ACPI for 2–4+ cells vs no cells (AUC = 0.74); Blue curve: IVI for 2–4+ cells vs no cells (AUC = 0.40); Pink curve: CCT for 0.5–1+ cells vs no cells (AUC = 0.61); Turquoise curve: ACPI for 0.5–1+ cells vs no cells (AUC = 0.58); Purple curve: IVI for 0.5–1+ cells vs no cells (AUC = 0.53). (C) Multiclass receiver operating characteristic curves for flare categories. Receiver operating characteristic curves for different flare levels using CCT, ACPI, and IVI. Blue curve: No flare (AUC = 0.66); Orange curve: 1+ flare (AUC = 0.66); Green curve: 2 to 3+ flare (AUC = 0.65). (D) Receiver operating characteristic curves for different flare levels vs no flare. Diagnostic utility of CCT, ACPI, and IVI in identifying different levels of flare in comparison to no flare. Red curve: CCT for 2 to 3+ flare vs no flare (AUC = 0.64); Orange curve: ACPI for 2 to 3+ flare vs no flare (AUC = 0.80); Blue curve: IVI for 2 to 3+ flare vs no flare (AUC = 0.63); Pink curve: CCT for 1+ flare vs no flare (AUC = 0.65); Turquoise curve: ACPI for 1+ flare vs no flare (AUC = 0.74); Purple curve: IVI for 1+ flare vs no flare (AUC = 0.55).

References

    1. Cunningham ETE, Zierhut M. Vision loss in uveitis. Ocul Immunol Inflamm. 2021; 29: 1037–1039, doi:10.1080/09273948.2021.2017152. - DOI - PubMed
    1. Whitcup SM, Sen HN. Whitcup and Nussenblatt's Uveitis. New York: Elsevier; 2022, doi:10.1016/C2014-0-04249-9. - DOI
    1. Kempen JH, Ganesh SK, Sangwan VS, Rathinam SR. Interobserver agreement in grading activity and site of inflammation in eyes of patients with uveitis. Am J Ophthalmol. 2008; 146: 813–818.e1, doi:10.1016/j.ajo.2008.06.004. - DOI - PubMed
    1. Agarwal A, Ashokkumar D, Jacob S, Agarwal A, Saravanan Y. High-speed optical coherence tomography for imaging anterior chamber inflammatory reaction in uveitis: clinical correlation and grading. Am J Ophthalmol. 2009; 147: 413–416, doi:10.1016/j.ajo.2008.09.024. - DOI - PubMed
    1. Sharma S, Lowder CY, Vasanji A, Baynes K, Kaiser PK, Srivastava SK. Automated analysis of anterior chamber inflammation by spectral-domain optical coherence tomography. Ophthalmology. 2015; 122: 1464–1470, doi:10.1016/j.ophtha.2015.02.032. - DOI - PubMed