. 2025 Jul 1;329(1):L70-L83.
doi: 10.1152/ajplung.00058.2025. Epub 2025 May 28.

Spatiotemporal calcium signaling patterns underlying opposing effects of histamine and TAS2R agonists in airway smooth muscle

Affiliations

Spatiotemporal calcium signaling patterns underlying opposing effects of histamine and TAS2R agonists in airway smooth muscle

Stanley Conaway Jr et al. Am J Physiol Lung Cell Mol Physiol. .

Abstract

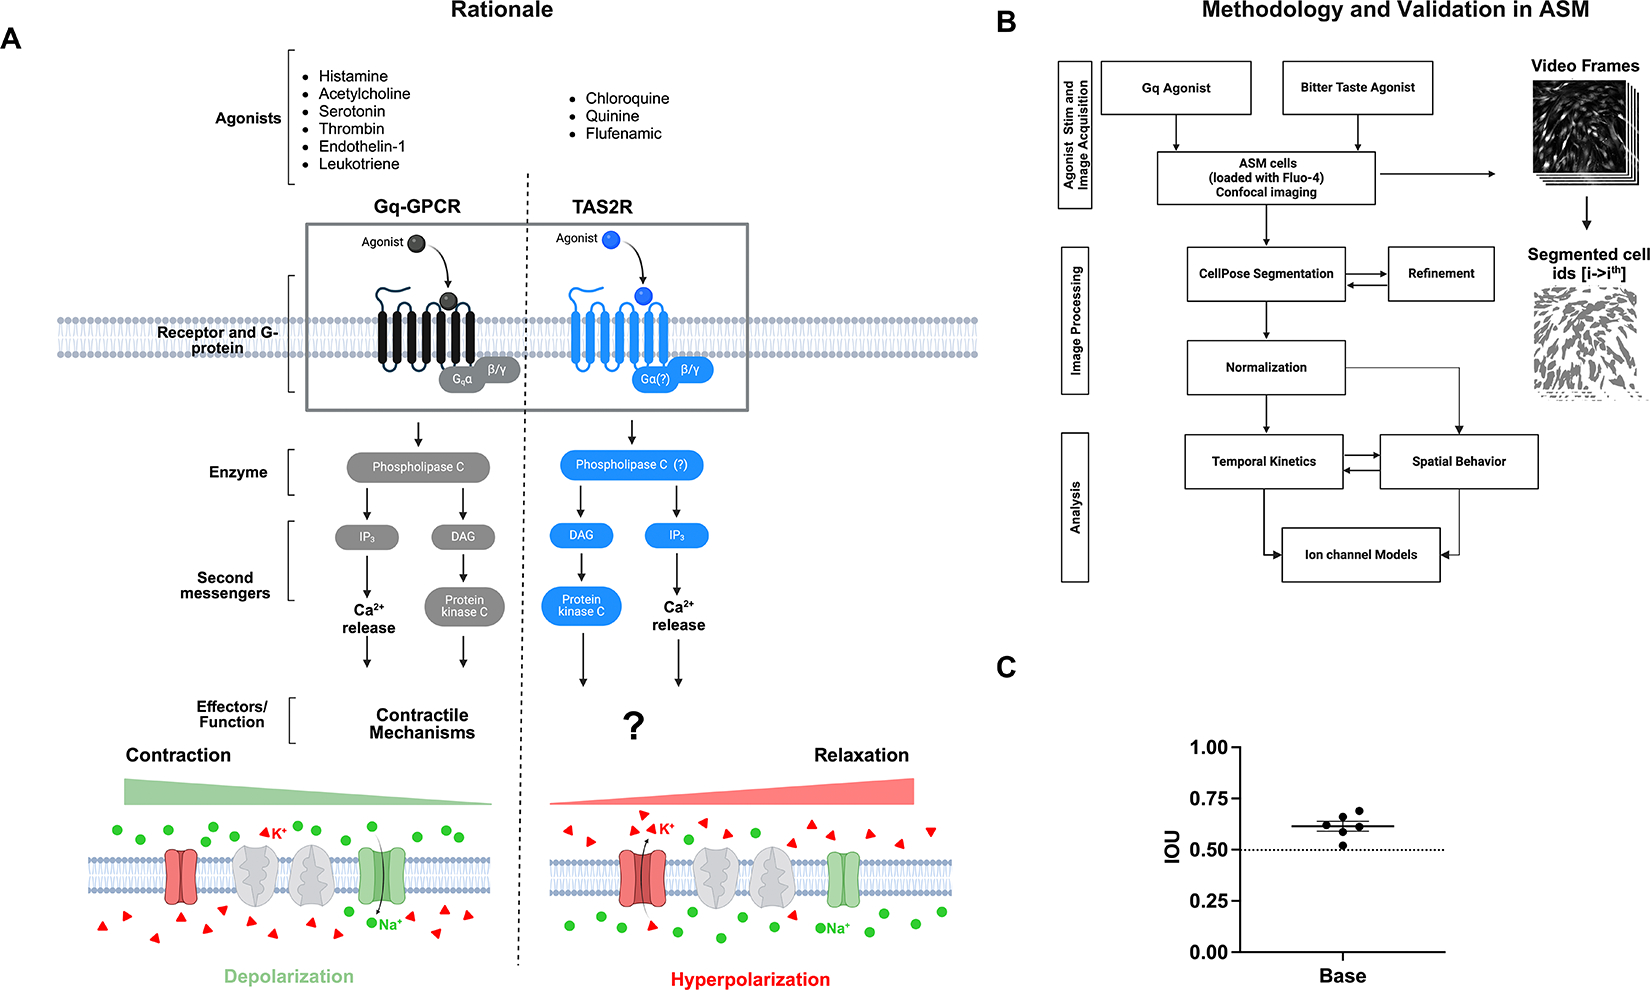
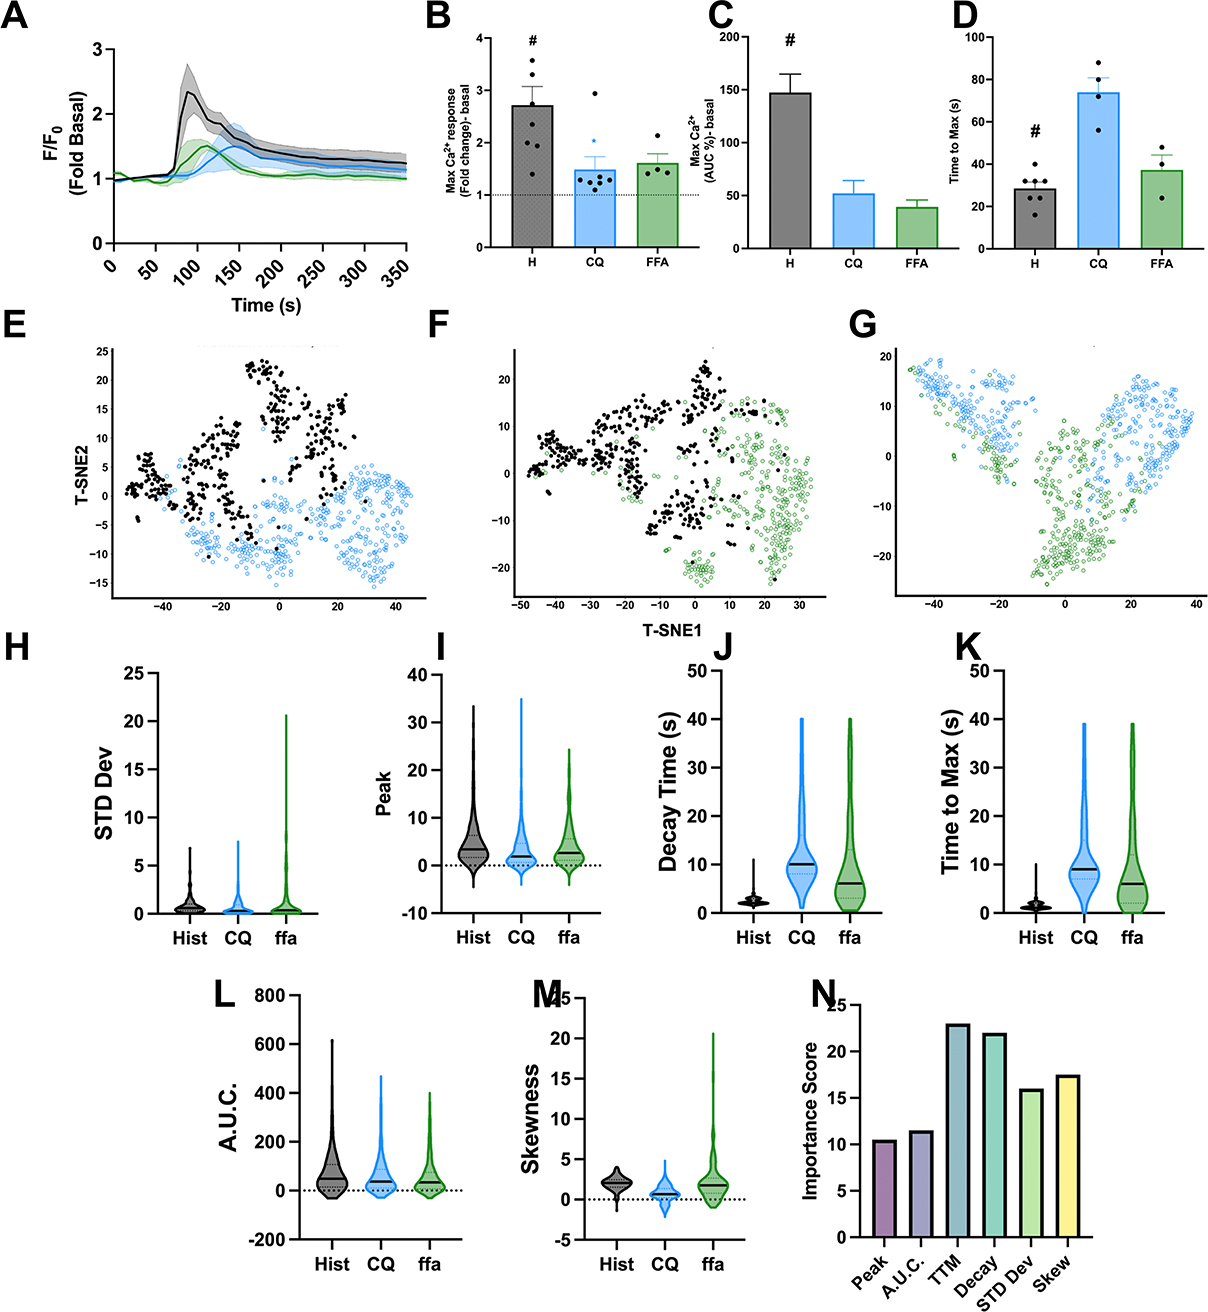
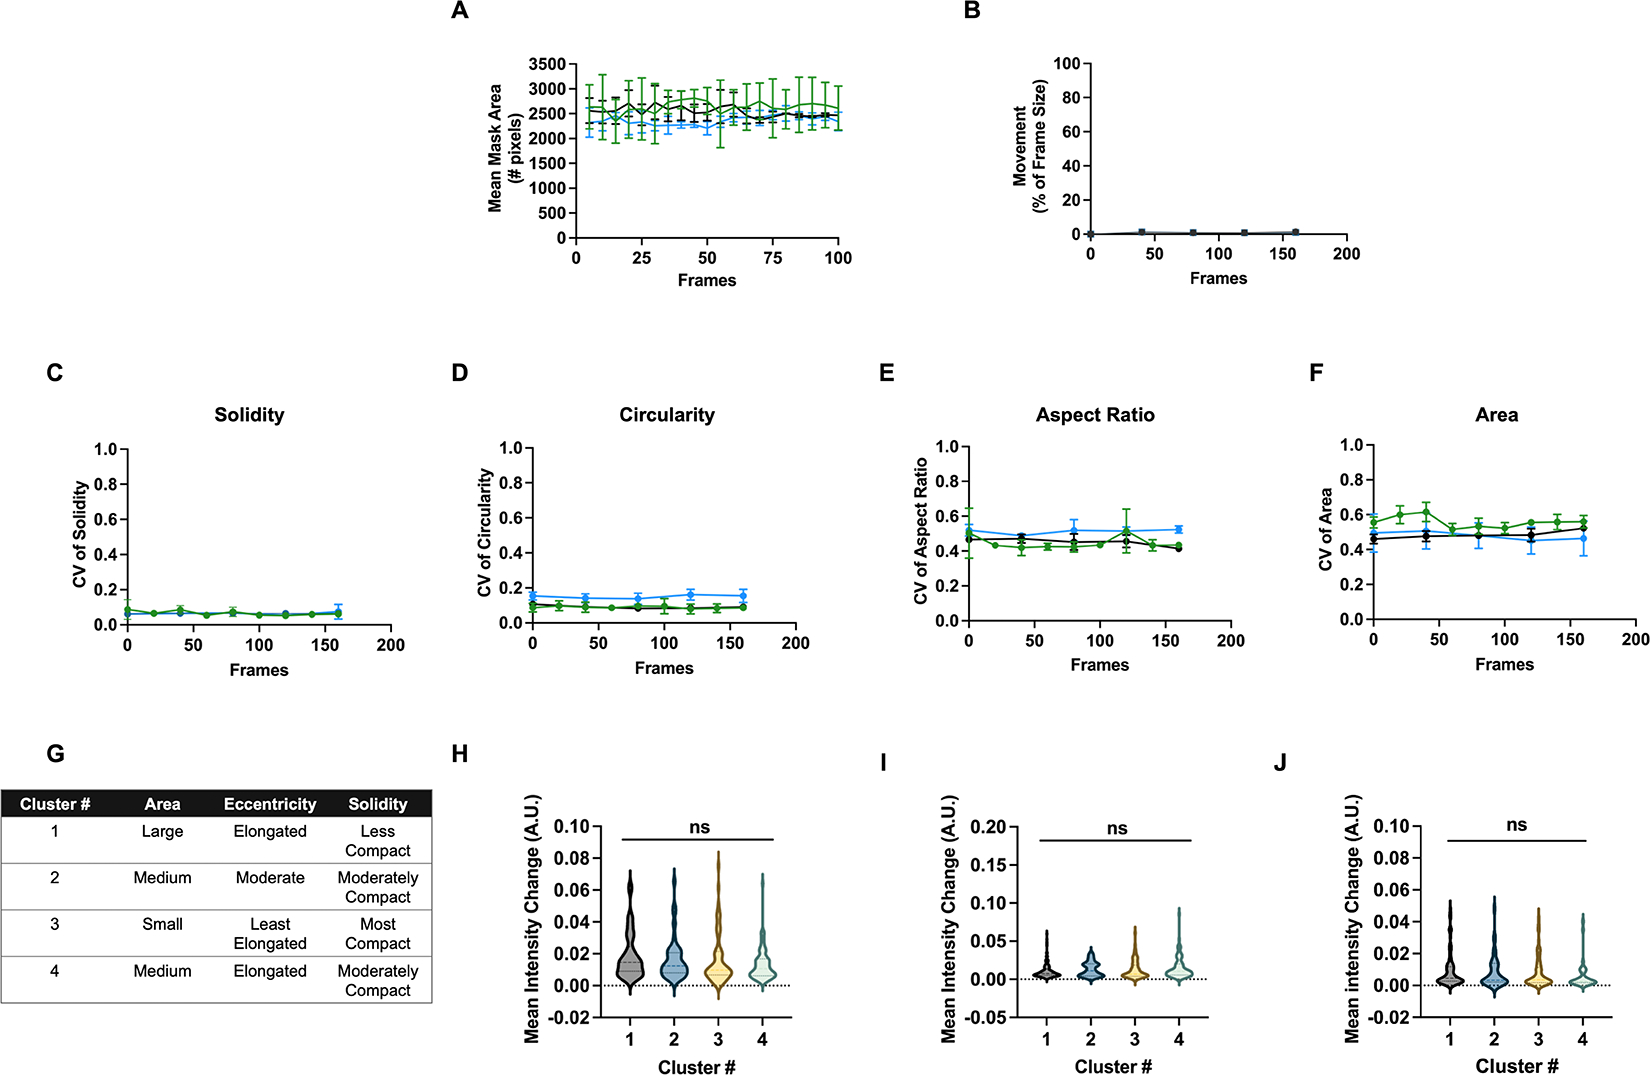
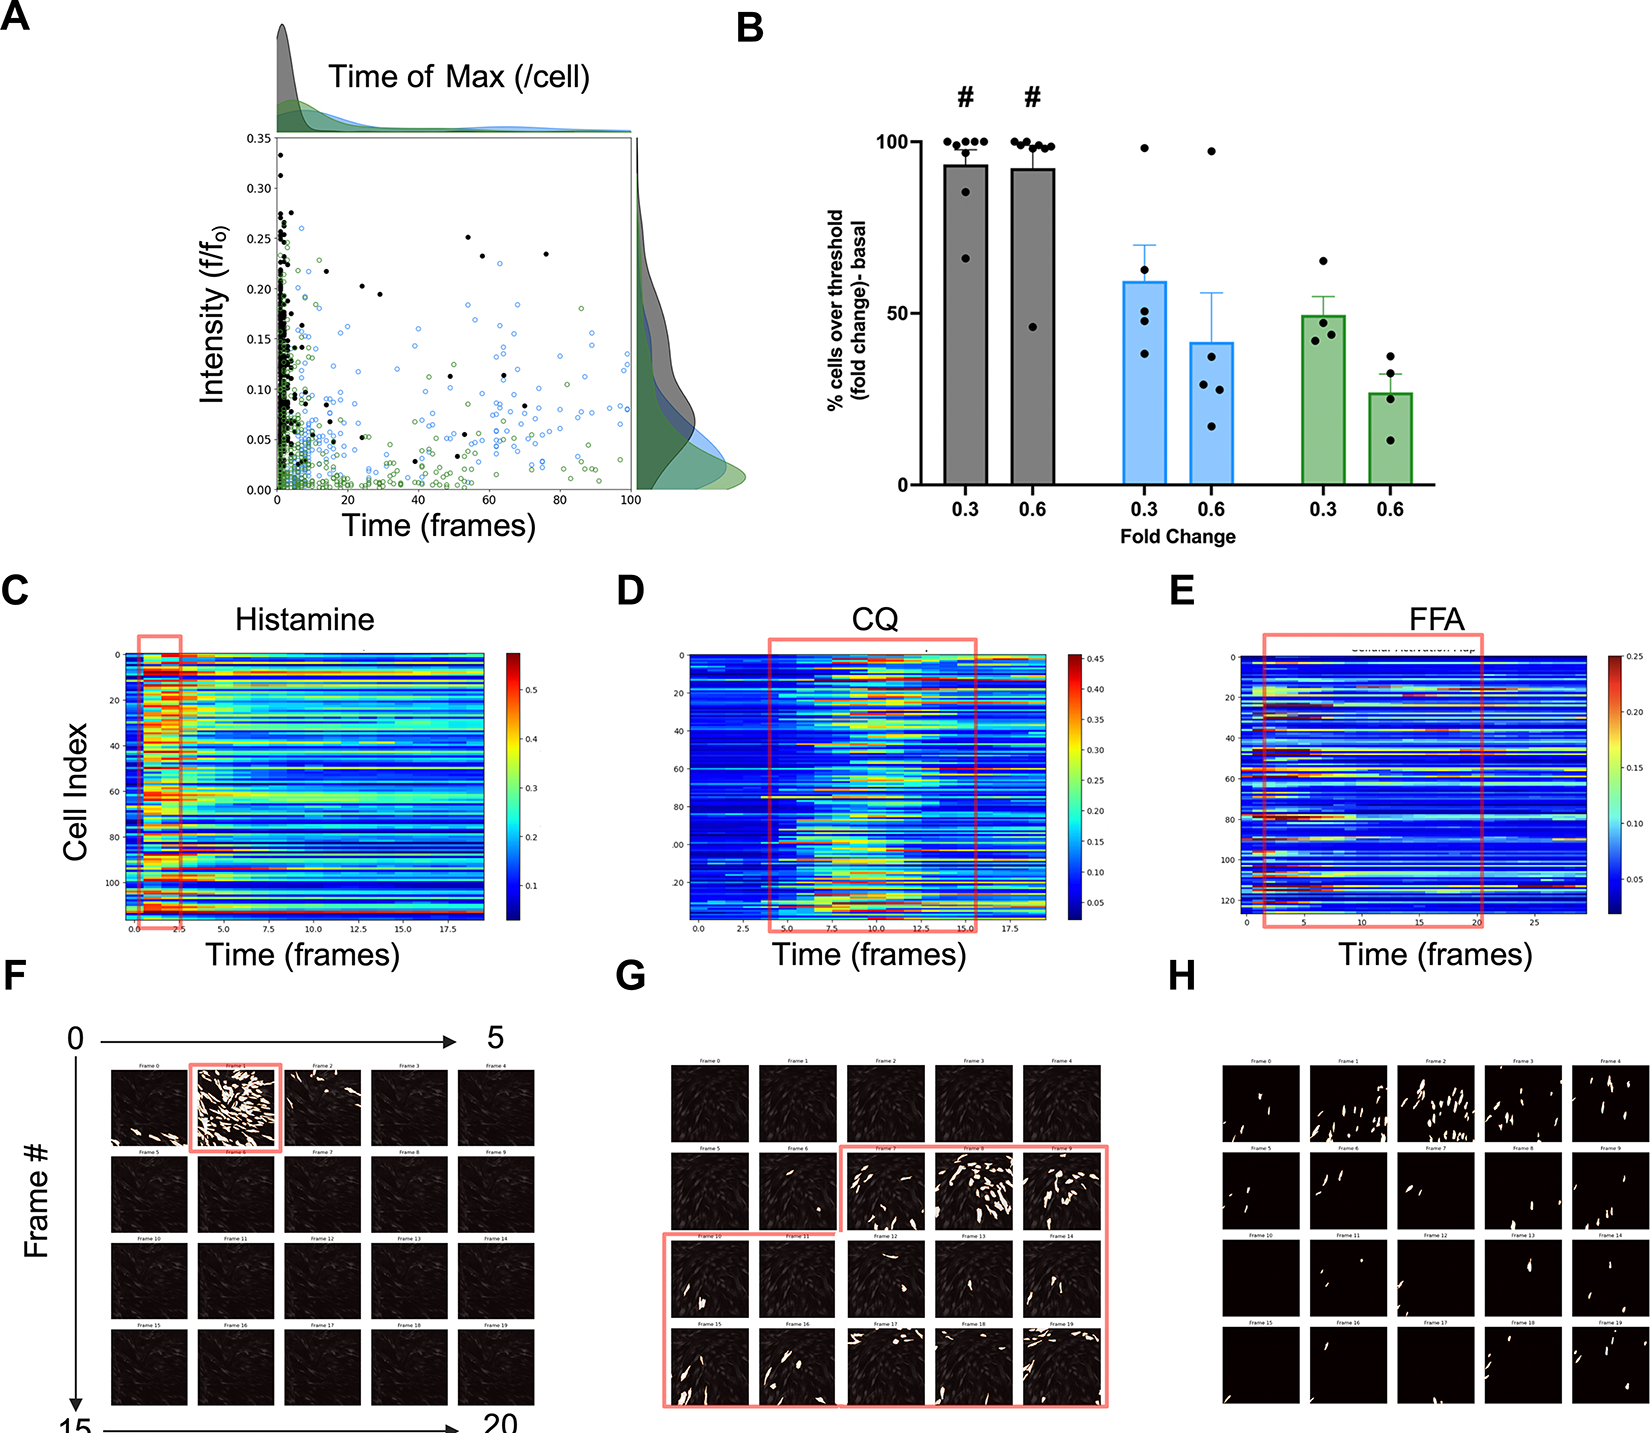
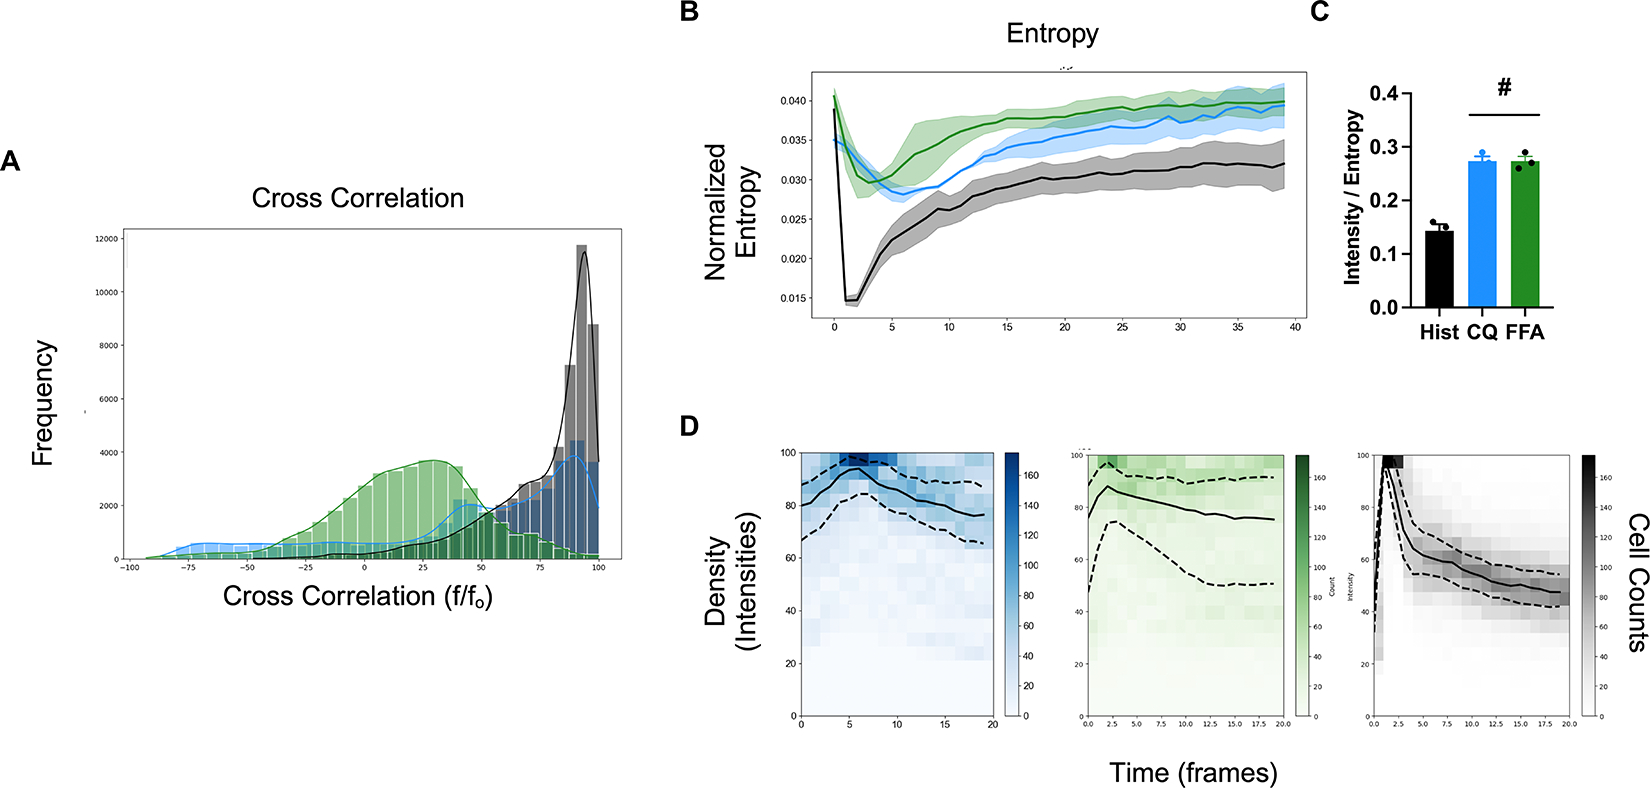
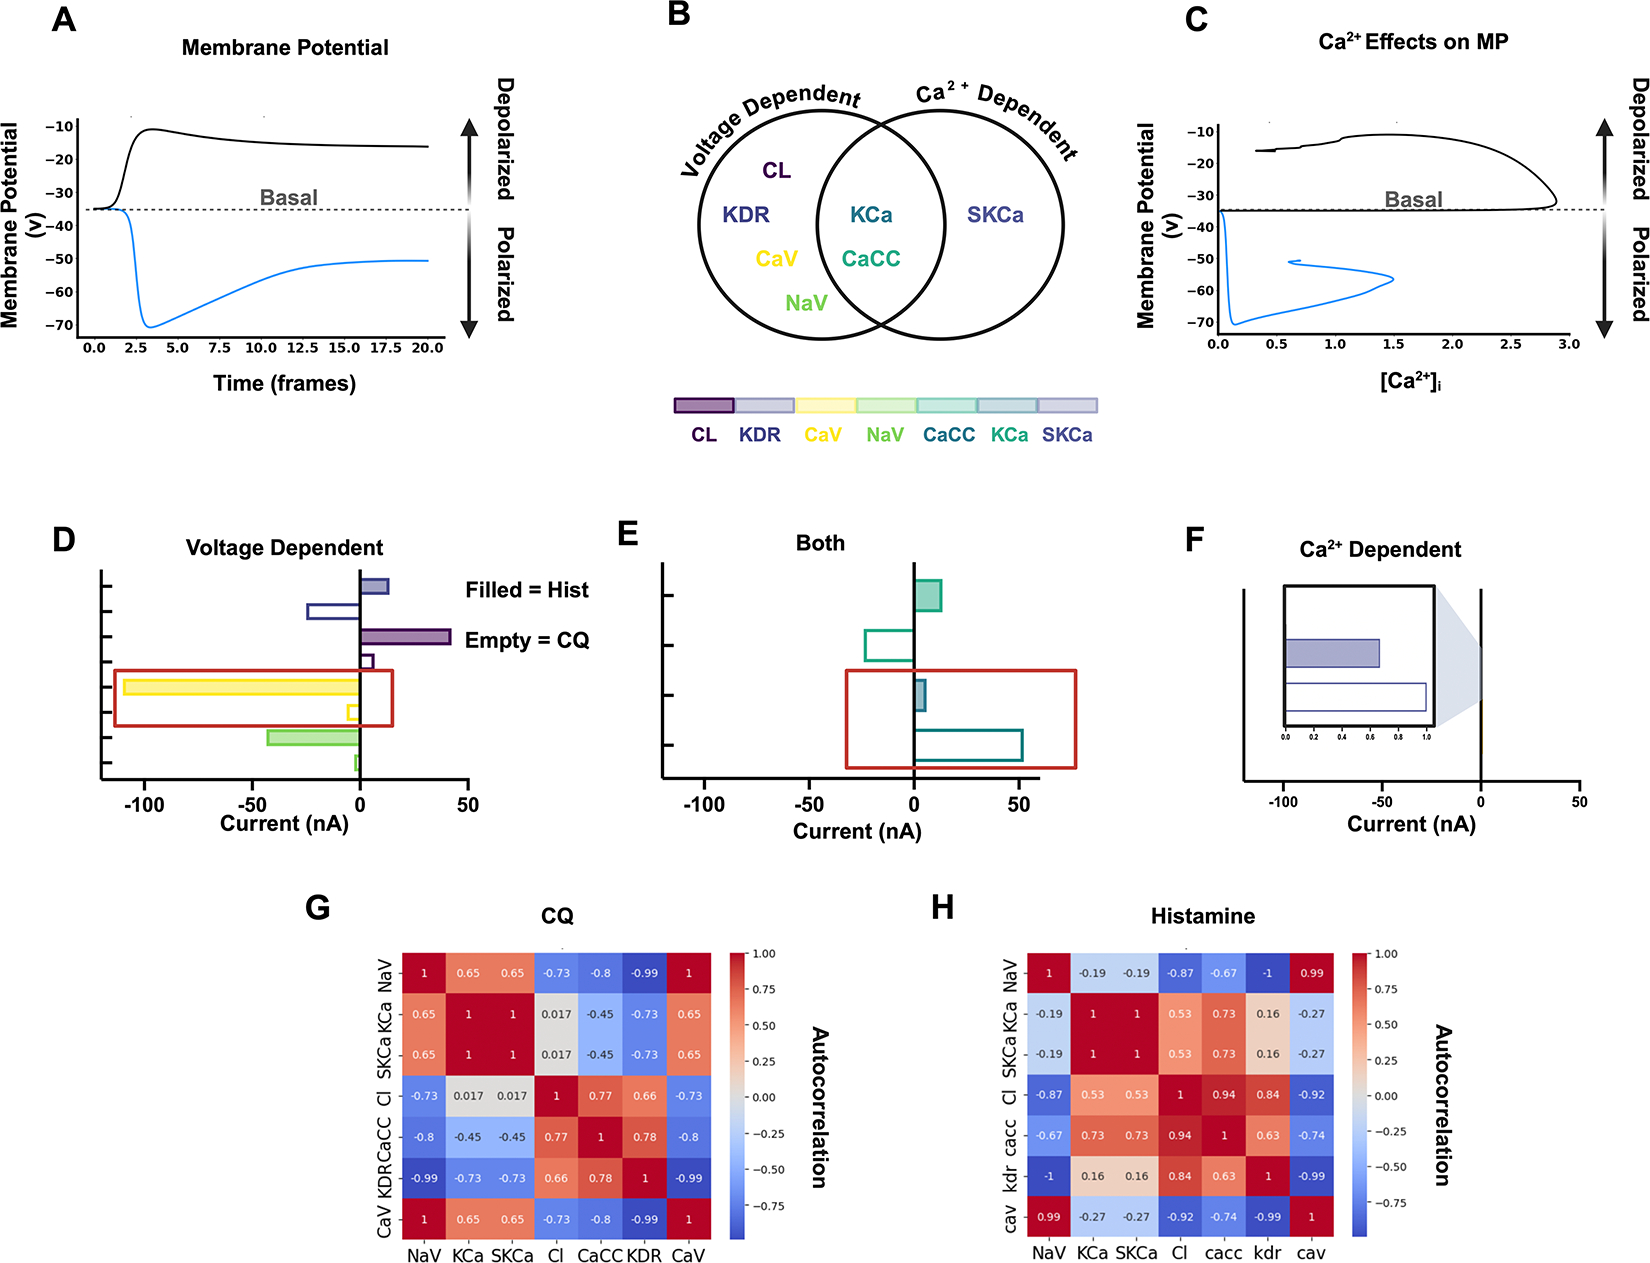
Intracellular calcium (Ca2+) release via phospholipase C (PLC) following G-protein-coupled receptor (GPCR) activation is typically linked to membrane depolarization and airway smooth muscle (ASM) contraction. However, recent findings show that bitter taste receptor agonists, such as chloroquine (CQ), induce a paradoxical and potent relaxation response despite activating the Ca2+ signaling pathway. This relaxation has been hypothesized to be driven by a distinct compartmentalization of calcium ions toward the cellular periphery, subsequently leading to membrane hyperpolarization, in contrast to the contractile effects of histamine. In this study, we further investigate the spatiotemporal dynamics of Ca2+ signaling in ASM cells using single-cell microscopy and deep learning-based segmentation, integrating the results into a comprehensive model of ASM ion channel dynamics to compare the effects of histamine, CQ, and flufenamic acid (FFA). Our results show that histamine induces a strong, synchronized calcium release, nearly twice as high as that of CQ, which produces a sustained but lower-magnitude response. Per-cell analysis reveals more variable and asynchronous Ca2+ signaling for CQ and FFA, with higher entropy compared with histamine. Integrating these findings into an ASM ion channel model, we observed that histamine-mediated Ca2+ release activates voltage-gated Ca2+ and Na+ channels (leading to depolarization). In contrast, CQ preferentially engages BKCa, SKCa, and chloride channels (promoting hyperpolarization). These findings provide insights into the unique mechanisms by which bitter taste receptor agonists can modulate ASM tone, offering potential therapeutic strategies for relaxing ASM and alleviating airway hyperresponsiveness in conditions such as asthma.NEW & NOTEWORTHY Using machine-learning methods, these studies identify spatiotemporal differences in calcium responses between agonists of Gq-coupled receptors and bitter taste receptors in airway smooth muscle cells. The findings provide deeper insights into the mechanism of action of bitter tastant-induced airway smooth muscle relaxation.

Keywords: TAS2R; airway smooth muscle; calcium; chloroquine.


Conflict of interest statement

Conflict-of-interest statement: The Authors have no conflict of interest.

Figures

Figure 1.
Figure 1.. Methodology and validation workflow.
(A) An illustration highlighting Gq and TAS2R agonists-mediated signaling pathways and their respective endpoint outcomes regarding ASM membrane potential and tone. (B) A diagram illustrating the workflow used for data acquisition, data processing, and deep learning-based computational analysis. See the Methods section for a detailed description of this approach. (C) Validation of different models of Cellpose software; Intersection Over Union (IOU) value of cyto 3 model of the Cellpose software.
Figure 2.
Figure 2.. Effect of CQ, FFA and Histamine on [Ca2+]i elevation in human ASM cells.
(A) Representative tracing and image of [Ca2+]i mobilization in ASM cells treated with CQ (blue), FFA (green) and histamine (black). Data normalized to basal mean fluorescent intensity. (B-D) Transients and subsequent analysis of % cells at their relative max at a given time point, illustrating maximum [Ca2+]i response, area under the curve (AUC), and time to maximum [Ca2+]i response. (E-G) T-SNE plots parsing out behavior differences of individual cells between treatment conditions in the context of cells at their maximum [Ca2+]i transient intensity (n=3). (H-M) Distribution of feature-specific individual cellular responses used for model training including Standard Deviation of intensities (H), Max (I), Decay time (J), Time to Max (K), A.U.C. (L), and Skew of distribution of intensities (M). (N) Relative importance score of random forest model features used to characterize cellular responses (n=1146) between agonist-specific experimental conditions. # p<.05 versus basal and * p<.05 versus histamine. Statistics were performed using one-way ANOVA with Bonferroni and are represented as mean ± SEM.
Figure 3.
Figure 3.. Assessment of changes in cell morphology and movement upon agonist stimulation.
(A) Analysis of the size of mask areas across frames is represented as the mean mask area in pixels. (B) Movement of cell centroids from frame to frame as a percentage of the total frame size. The coefficient of variation of computed morphological metrics, including (C) solidity, (D) circularity, (E) aspect ratio, and (F) area from frame to frame. (G) Table showing clusters of cells based on morphological characteristics. The calcium response in cells in response to treatment with (H) Histamine, (I) CQ, and (J) FFA was further stratified based on the morphological features of cells.
Figure 4.
Figure 4.. Examination of agonist-specific temporal variations in [Ca2+]i signaling dynamics.
(A) Scatter plot showing time points at which individual cells reach their max between treatment conditions in the context of cellular activity fold change over the basal signal. Also found are inset density plots showing the distribution of these points over the plot. (B) Analysis of the percentage of individual cells eliciting [Ca2+]i transients above various activation thresholds (fold change over baseline). (C-E) Cellular activation maps of a representative video from treatment groups (cell line 032020) for histamine (left), CQ (middle) and FFA (right). (F-H) Display of frames from experiments for histamine (left), CQ (middle) and FFA (right) highlighting the variation in the time points and coordination at which cells reach their max activity. Highlighted in red between C and E is the length of time between when the first and last cells reach their max signal intensity (n=4–8). #p<.05 versus basal and *p<.05 versus histamine. Statistics were performed using one-way ANOVA with Bonferroni with p-value < 0.05.
Figure 5.
Figure 5.. Effect of CQ, FFA, and histamine on spatial coordination of [Ca2+]i response in human ASM cells.
(A) Histogram of a cross-correlation matrix between identified cells and increases in intensity between agonist conditions. (B) Transients showing calculations of entropy normalized to aggregate intensity over the course of the stimulation. The inset plot shows that the minima of both transients corresponding to the initial peak phase are significantly different from one another. (C) 2d histogram of intensities at each time point shows the number of cells involved in each fluorescent fluctuation, which was used in the calculations of entropy. (D) Also included are overlapped line plots of percentiles, where a wider spread for CQ and FFA at the initial phase of calcium release results in significant differences in entropy between the TAS2R agonists and histamine (n=3). Statistics were performed using one-way ANOVA with Bonferroni with p-value < 0.05.
Figure 6.
Figure 6.. Models of ion channels predict dichotomy in hyper/de-polarization of the membrane in response to CQ- and histamine-mediated [Ca2+]i dynamics.
(A) Transients displaying differences in membrane potential for CQ (blue) and histamine (black). (B) Venn diagram categorizing ion channels with respect to their method(s) of activation. (C) Line graph showing membrane potential (voltage) with respect to [Ca2+]i concentration between both groups. (D) Bar graph of the mean activity of voltage-activated ion channels in response to both treatment conditions. (E) Bar graph denoting mean activity of both voltage- and Ca2+-activated ion channels between treatment groups. Highlighted with a red box for both (D) and (E) are the ion channels most responsible for driving membrane depolarization (CaV) or hyperpolarization (BKCa) between treatment groups. (F) Bar graph of the mean activity of the Ca2+-activated ion channel. Heatmaps showing the activation of the various ion channels relative to the activity of the others as measured by autocorrelation for CQ (G) and histamine (H).

Similar articles

References

    1. Billington CK, and Penn RB (2003) Signaling and regulation of G protein-coupled receptors in airway smooth muscle. Respir Res 4, 2. - PMC - PubMed
    1. Deshpande DA, and Penn RB (2006) Targeting G protein-coupled receptor signaling in asthma. Cell Signal 18, 2105–2120 - PubMed
    1. Murray RK, and Kotlikoff MI (1991) Receptor-activated calcium influx in human airway smooth muscle cells. J Physiol 435, 123–144 - PMC - PubMed
    1. Shieh CC, Petrini MF, Dwyer TM, and Farley JM (1991) Concentration-dependence of acetylcholine-induced changes in calcium and tension in swine trachealis. J Pharmacol Exp Ther 256, 141–148 - PubMed
    1. Sims SM, Jiao Y, and Zheng ZG (1996) Intracellular calcium stores in isolated tracheal smooth muscle cells. Am J Physiol 271, L300–309 - PubMed

MeSH terms

LinkOut - more resources