. 2025 May 30;11(22):eadt5833.
doi: 10.1126/sciadv.adt5833. Epub 2025 May 28.

Deciphering linezolid-induced hematologic toxicity: Targeting TOP2A and TOP2B via its primary metabolite PNU142586

Affiliations

Deciphering linezolid-induced hematologic toxicity: Targeting TOP2A and TOP2B via its primary metabolite PNU142586

Vo Thuy Anh Thu et al. Sci Adv. .

Abstract

Linezolid, an oxazolidinone antibiotic, is widely used to treat multidrug-resistant tuberculosis and drug-resistant Gram-positive infections. However, prolonged use is associated with severe hematologic toxicity, the underlying mechanisms of which remain incompletely understood, particularly regarding the role of linezolid metabolites. Our clinical study indicates that elevated exposure to PNU142586, a primary metabolite of linezolid, is associated with an increased risk of linezolid-induced toxicity, even in the absence of renal impairment. To elucidate its mechanism, we identify DNA topoisomerase 2-α (TOP2A) and DNA topoisomerase 2-β (TOP2B) as primary targets of PNU142586 at molecular, cellular, and in vivo levels. PNU142586 disrupts replication and transcription by impeding DNA binding to TOP2A and TOP2B with a favorable conformation for cleavage and by inhibiting adenosine 5'-triphosphate hydrolysis, ultimately leading to antiproliferative and cytotoxic effects, including mitochondrial dysfunction. The present study thus provides mechanistic insight into linezolid-induced hematologic toxicity and offers a foundation for safer antibiotic development and improved clinical monitoring through biomarker identification.


Figures
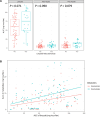
Fig. 1.
Fig. 1.. The exposure of LZD metabolites, particularly PNU142586, was associated with LZD-induced toxicity in the clinical study.
(A) AUCs of LZD, PNU142300, and PNU142586 stratified by LZD-induced toxicity. (B) Linear regression between AUCs of LZD and metabolites. The linear correlation between AUCs of LZD and PNU142300 was 0.059 × LZD + 2.091 (r2 = 0.13). The linear correlation between AUCs of LZD and PNU142586 was 0.089 × LZD + 3.031 (r2 = 0.14).
Fig. 2.
Fig. 2.. Targeted docking confirms the potential interaction between LZD metabolites and TOP2.
(A) Comparison of LZD (green) and LZD metabolites PNU142586 (magenta) and PNU142300 (cyan) docked to the TOP2A ATPase domain (PDB ID: 1zxm) with a magnified view of the binding between the ligands and protein at the active site. The protein is depicted as a blue cartoon model. Analysis of interactions between the binding site of the TOP2A ATPase domain and LZD (B), PNU142596 (C), and PNU142300 (D). All residues that interact with the corresponding compound are presented as sticks. Hydrogen bonds are shown by black dotted lines, and halogen bonds are represented by yellow dotted lines. Hydrogen atoms are omitted for clarity.
Fig. 3.
Fig. 3.. The LZD metabolite PNU142586 is an inhibitor of TOP2A and TOP2B.
The kNDA decatenation activity of TOP2A (A) and TOP2B (C) was measured in the presence of LZD or its metabolites PNU142586 and PNU142300 (in mM). Novobiocin (Novo) was used as the positive control. The scDNA relaxation activity of TOP2A (B) and TOP2B (D) was measured in the presence of LZD or its metabolites PNU142586 and PNU142300 (in mM). Etoposide (VP16) was used as the positive control. K, catenated kDNA; D, decatenated kDNA; SC, supercoiled forms of the plasmid; R, relaxed forms of the plasmid.
Fig. 4.
Fig. 4.. PNU142586 is a catalytic inhibitor of TOP2.
(A) In ethidium bromide (EB) displacement assays, DNA (salmon sperm DNA, 100 μM) was mixed with or without ethidium bromide (2 μg/ml) together with the indicated chemicals. Reactions were subjected to fluorescence emissions of 590 nm and excitation of 535 nm. AU, arbitrary units. (B) DNA cleavage assays were conducted using human TOP2A and TOP2B incubated with etoposide (VP16, 2.5 mM), DMSO, or PNU142586 (in mM) in the presence of supercoiled plasmid DNA along with ATP. (C) DNA cleavage assays were conducted using human TOP2A and TOP2B incubated with the supercoiled plasmid DNA in the presence of VP16 and PNU142586 (in mM) in a reaction buffer with ATP. Reaction products from (B) and (C) were separated by electrophoresis of agarose gel containing ethidium bromide. N, nicked DNA; L, linear DNA; SC, scDNA; Linear, linear marker.
Fig. 5.
Fig. 5.. PNU142586 directly binds to TOP2.
Trp fluorescence spectra of the TOP2A DNA binding domain (A) and ATPase domain (C) were recorded at increasing concentrations of PNU142586. Insets show the titrated concentrations. Fluorescence titrations with LZD, PNU142300, and PNU142586 at a single wavelength were normalized by dividing the measured fluorescence (F) by the fluorescence in the absence of the compound (Fo) and plotted to assess binding affinities in the DNA binding domain (B) and ATPase domain (D). Solid lines represent fits to a site-specific binding model. (E) Surface representation of the TOP2A DNA binding domain (PDB ID: 5gwk) docked with PNU142586 in the putative drug-binding pocket is shown (green box). Magnified views highlight the pocket using surface (orange box) and cartoon (blue box) representations. (F) Trp fluorescence spectra of the DNA binding domain were measured with increasing concentrations of PNU142586 in the absence (left) or presence (right) of a CTD linker peptide. Insets show the titrated concentrations. (G) Fluorescence titrations of PNU142586, with and without the CTD linker peptide, were normalized to Fo and plotted to determine binding affinities. Solid lines indicate fits to a site-specific binding model.
Fig. 6.
Fig. 6.. PNU142586 suppresses human blood cell proliferation through TOP2A and TOP2B.
HL-60 and THP-1 cells were treated with various concentrations of LZD or PNU142586. After incubation for 144 hours, the cells were directly treated with MTS tetrazolium salt for 2 hours at 37°C to examine proliferation (A), or the supernatant was collected for cytotoxicity testing (B). The HL-60 and THP-1 cells were then treated with the highest concentration of LZD or PNU142586 (100 μM). At different time points, cells were directly treated with MTS tetrazolium salt for 2 hours at 37°C to examine proliferation (C), or the supernatant was collected for cytotoxicity testing (D). (E) HL-60 cells were treated with DMSO or 10 to 20 μM etoposide (VP16), 10 to 20 μM LZD, or PNU142586 for 2 hours. Immunoblotting measured p-H2A.X levels in the cells, with β-actin as a loading control. The HL-60 cells were then cotreated with 50 μM VP16 and 50 μM LZD or 50 μM PNU142586 for 2 hours. Immunoblotting measured p-H2A.X levels in the cells, with β-actin as the loading control. (F) Cells were knocked down for TOP2A and TOP2B using siRNA, and the efficacy was examined using Western blots after 72 hours. The cells were then collected and treated with LZD or PNU142586 to examine cell proliferation and cytotoxicity (G and H) after 144 hours. Cells were treated with various concentrations of LZD or PNU142586 for 120 hours or the highest concentration at different time points. RNA was then extracted for gene expression analysis (I), or MT-CO1 levels were detected using Western blots (J). *P < 0.05 and **P < 0.005 versus 0 hours or the DMSO or control group. h, hours.
Fig. 7.
Fig. 7.. PNU142586 exhibits in vivo toxicity through the inhibition of TOP2 and suppresses mitochondrial gene transcription.
(A) Effects of LZD and PNU142586 exposure on the morphology of X. laevis oocytes over 168 hours. The change in pigmentation in the animal and vegetal poles is indicated by red arrows. DMSO (2%) was used as the control. Scale bar, 500 μm. (B) Malformation rate for the X. laevis oocytes (n = 30; 10 oocytes in triplicate for each group). Means ± SD. (C) The kNDA decatenation activity for Xenopus oocyte extract was measured in the presence of LZD or PNU142586 (in mM). Novobiocin (in mM) was used as the positive control. (D) Effects of LZD and PNU142586 exposure on the development of zebrafish larvae. Morphological abnormalities were observed daily from treatment at 24 to 120 hpf. DMSO (0.1%) was used as the control (n = 40; 10 larvae in quadruplicate for each group). Means ± SD. PE, pericardial edema; YSE, yolk sac edema; BT, bent tail. (E) Expression analysis of the mt-co1 gene in LZD- and PNU142586-treated zebrafish larvae at 72 and 120 hpf. RNA was extracted from the treated larvae after imaging (n = 30; 10 larvae in triplicate for each group). Means ± SEM.

Similar articles

References

    1. Swaney Steve M., Aoki H., Ganoza M. C., Shinabarger Dean L., The oxazolidinone linezolid inhibits initiation of protein synthesis in bacteria. Antimicrob. Agents Chemother. 42, 3251–3255 (1998). - PMC - PubMed
    1. Wilson D. N., Schluenzen F., Harms J. M., Starosta A. L., Connell S. R., Fucini P., The oxazolidinone antibiotics perturb the ribosomal peptidyl-transferase center and effect tRNA positioning. Proc. Natl. Acad. Sci. U.S.A. 105, 13339–13344 (2008). - PMC - PubMed
    1. Wilcox M. H., Efficacy of linezolid versus comparator therapies in Gram-positive infections. J. Antimicrob. Chemother. 51, ii27–ii35 (2003). - PubMed
    1. Bain K. T., Wittbrodt E. T., Linezolid for the treatment of resistant gram-positive cocci. Ann. Pharmacother. 35, 566–575 (2001). - PubMed
    1. Cattaneo D., Marriott D. J. E., Gervasoni C., Hematological toxicities associated with linezolid therapy in adults: Key findings and clinical considerations. Expert Rev. Clin. Pharmacol. 16, 219–230 (2023). - PubMed