. 2025 May 30;11(22):eadt2771.
doi: 10.1126/sciadv.adt2771. Epub 2025 May 28.

PIEZO1-mediated calcium signaling reinforces mechanical properties of hair follicle stem cells to promote quiescence

Affiliations

PIEZO1-mediated calcium signaling reinforces mechanical properties of hair follicle stem cells to promote quiescence

Jingjing Wang et al. Sci Adv. .

Abstract

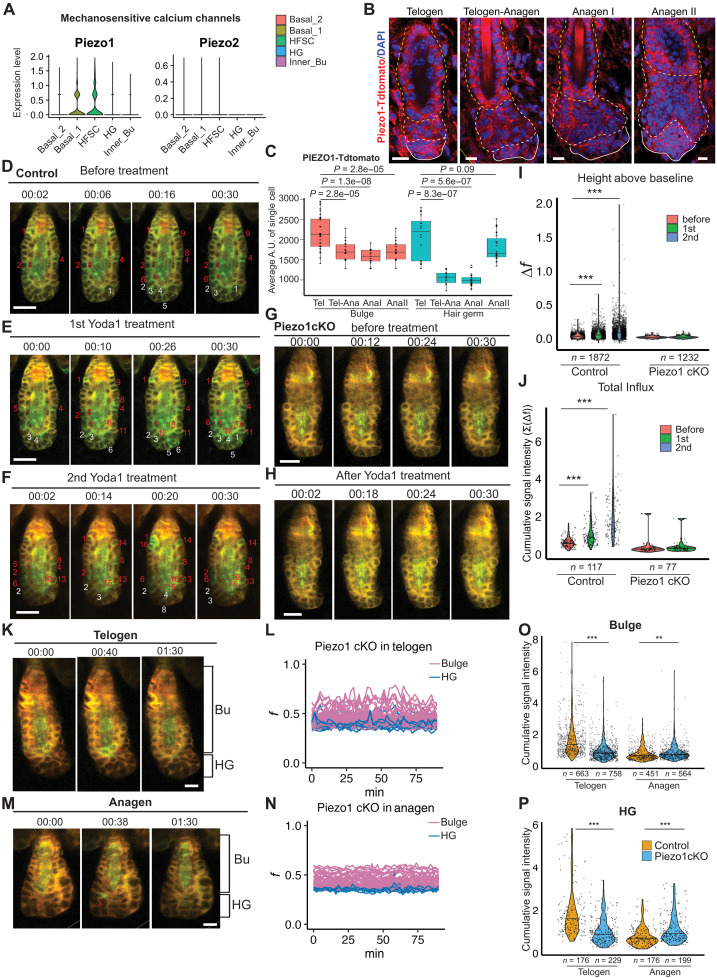
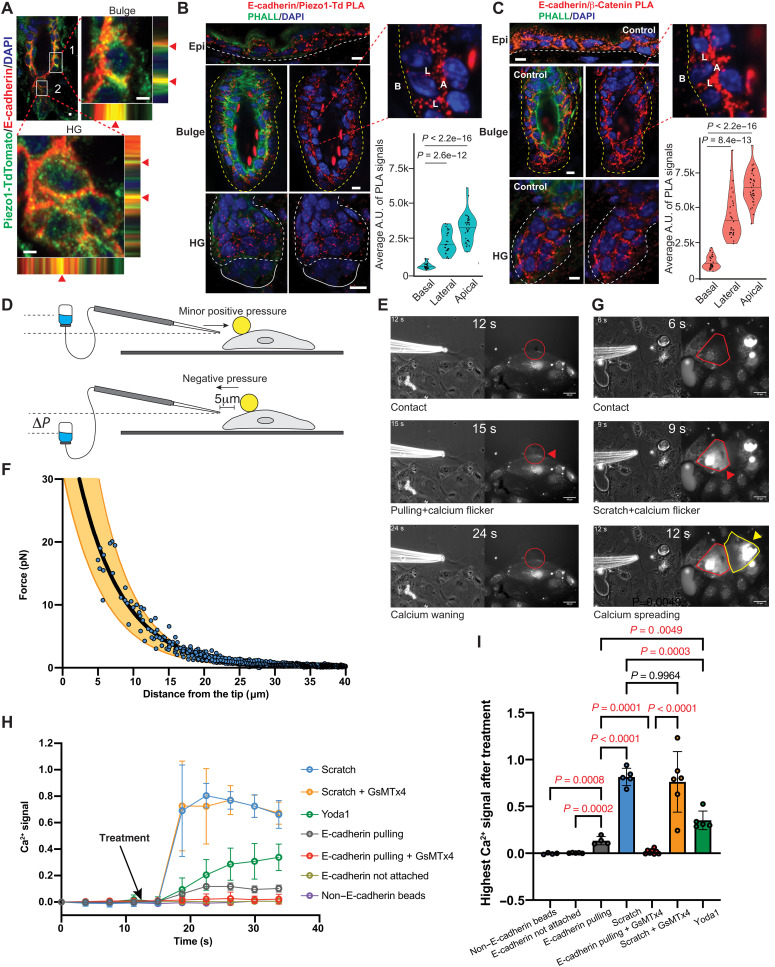
The mechanisms by which epithelial stem cells (SCs) sense mechanical cues within their niche and convert the information into biochemical signals to govern their function are not well understood. Here, we show that hair follicle SCs (HF-SCs) sense mechanical forces through cell adhesion and maintain quiescence in a PIEZO1-dependent mechanism. PIEZO1 interacts with E-cadherin in HF-SCs, and mechanical pulling of E-cadherin with a force of ~20 pN triggers PIEZO1-dependent, localized calcium flickers. Deletion of Piezo1 leads to reduced cumulative calcium influx and compromises quiescence. Single-cell genomic analyses identify a transcriptional network involving AP1 and NFATC1, which functions downstream of PIEZO1 and regulates the expression of extracellular matrix, cell adhesion, and actin cytoskeleton genes to reinforce the unique mechanical property of HF-SCs. These findings establish the force threshold necessary for PIEZO1 activation and reveal PIEZO1-dependent calcium influx as a key mechanism for sensing mechanical cues in the niche and regulating HF-SC activity.


Figures

Fig. 1.
Fig. 1.. HF-SC compartments display differential calcium dynamics during quiescence and activation.
(A) High-intensity calcium spike (arrowhead) recorded in the epidermis. Each image is annotated with the elapsed time from the start of the experiment. Scale bar, 20 μm. (B) Quantification of the calcium spike recorded in (A). The graph shows the fold change in the ratio of GCaMP6f to tdTomato fluorescence (rr0) as a function of time. (C) Calcium spike (arrowhead) recorded in bulge HF-SCs. Each image is annotated as in (A). Scale bar, 20 μm. (D) Quantification of the calcium spike observed in (C) in the same manner as in (B). (E and G) Calcium spikes (numbered) observed in the bulge (Bu) and HG compartments in telogen (E) and anagen (G). Red numbers indicate bulge cells with calcium spike events, and white numbers indicate HG cells with calcium spike events. Identical HFs with more time points are shown in fig. S4. Scale bar, 10 μm. (F and H) Normalized calcium signals (f) of all HF-SCs and HG cells in telogen (F) over 90 min and in anagen (H) over 90 min. Each purple line represents calcium signals for an HF-SC cell. Blue lines show calcium signals for HG cells. (I) Calcium signal change (Δf) of bulge HF-SC and HG cells in telogen and anagen. A total of 663 bulge cells and 176 HG cells of 17 telogen HFs, 451 bulge cells of 14 anagen HFs, and 176 HG cells of 12 anagen HFs, from four animals, are quantified. Total signal events are indicated by n numbers in the panel. Statistical significance was determined by Mann-Whitney U test (***P < 0.001). (J) Cumulative calcium signals of bulge HF-SC and HG cells are reduced in anagen compared to telogen. Statistical significance was determined by Mann-Whitney U test (***P < 0.001).
Fig. 2.
Fig. 2.. PIEZO1 mediates calcium influx in HF-SC compartments.
(A) Expression pattern of Piezo1 and Piezo2 detected by scRNA-seq. (B) Immunofluorescence staining reveals PIEZO1 expression in bulge HF-SCs and HG cells during the first telogen and early anagen phases. Scale bars, 20 μm. (C) Quantification of Piezo1-tdT signals in (B) in the bulge and HG. P values are calculated by Student’s t test. (D to F) Yoda1 treatment (100 μl of 100 μM) increases calcium influx in control HFs. Time-lapse images show the progression of the calcium spikes. Red numbers indicate bulge cells with calcium influx events, and white numbers show HG cells with calcium influx events. Scale bars, 20 μm. (G and H) Yoda1 treatment does not increase calcium influx in Piezo1 cKO HFs. Scale bars, 15 μm. (I) Quantification of calcium changes of control (left) and Piezo1 cKO (right) HFs after Yoda1 treatment. n indicates the number of signal events from 4 pairs of animals, before and after Yoda1 treatment. Statistical significance was determined by Mann-Whitney U Test (***P < 0.001). (J) Cumulative calcium signals of control (left) and Piezo1 cKO (right) after Yoda1 treatment. Statistical significance was determined by Mann-Whitney U test (***P < 0.001). (K and M) HF-SC compartments in Piezo1 KO show reduced calcium dynamics in telogen (K) and early anagen (M). Scale bars, 10 μm. (L and N) Normalized calcium signal in Piezo1 cKO bulge and HG cells over 90 min in telogen (L) and early anagen (N). (O and P) Deletion of Piezo1 reduced cumulative calcium influx in HF-SC compartments including the bulge (O) and HG (P) in telogen. n indicates the number of cells from five control animals and six Piezo1 cKO animals. Statistical significance was determined by Mann-Whitney U test (**P < 0.01 and ***P < 0.001). A.U., arbitrary unit.
Fig. 3.
Fig. 3.. Force–through–E-cadherin triggers PIEZO1-mediated calcium flicker.
(A) Colocalization of Piezo1-tdTomato and E-cadherin in bulge HF-SC and HG. Scale bars, 2 μm. (B) PLA shows the colocalization of Piezo1-tdTomato and E-cadherin. The insert shows the PLA signals in the lateral (L) and apical (A) sides but not the basal (B) side of the HF-SCs. P values are calculated by Student’s t test. Scale bars, 5 μm. (C) Colocalization of E-cadherin and β-catenin. The insert shows the PLA signals in the lateral (L) and apical (A) sides but not the basal (B) side of the HF-SCs. P values are calculated by Student’s t test. Scale bars, 5 μm. (D) Schematic illustration of the manipulation of E-cadherin–coated microbeads by the micropipette system. (E) Representative images of microbead manipulation (left, bright field) and calcium imaging (right, fluorescence) experiments. At 12 s, the micropipette contacts the microbead. At 15 s, the microbead is pulled by the micropipette, and a localized calcium flicker is recorded (red circle and arrowhead). At 24 s, the calcium signal is waned. (F) Force-distance curve is calibrated to determine the force (~20 pN) applied to the microbeads. The black and orange curves represent the averaged fit and range of 10 experiments, respectively. (G) Representative images of surface scratch (left, bright field) and calcium imaging (right, fluorescence) experiments. At 6 s, the micropipette contacts the cell surface, and no calcium flicker is recorded (red polygon). At 9 s, surface scratch activates strong calcium signal on the scratched cell (red polygon and arrowhead). At 12 s, calcium signal is spread to the neighboring cell (yellow polygon and arrowhead). (H and I) Quantification of calcium signals in the pulling and scratching experiments with or without Yoda1, a PIEZO1 agonist, and GsMTx4, a PIEZO1 inhibitor. Statistical significance is determined by ordinary one-way analysis of variance (ANOVA) test. DAPI, 4′,6-diamidino-2-phenylindole.
Fig. 4.
Fig. 4.. Deletion of Piezo1 shortens the telogen length and promotes hair regeneration.
(A) Schematics of the Krt5-CreER/Piezo1fl/fl iKO model and a Rosa-LSL- tdTomato model for deleting Piezo1 and marking the KO cells. (B) Piezo1 iKO promotes dorsal hair regeneration upon the deletion in early telogen by administration of Tamoxifen from P42 to P48. Seven pairs of animals, four female and three male pairs, were used for phenotypical analysis. (C) H&E staining shows accelerated hair regeneration in Piezo1 iKO. Scale bars, 100 μm. (D) Intravital imaging tracking of the same control HFs captures three hair cycles from P65 (the third hair cycle) to P247 (the fifth hair cycle). Forty HFs from two control animals were tracked for the study. Scale bar, 100 μm. (E) Timeline of hair cycle stages for control HFs tracked by intravital microscopy. (F) Intravital imaging tracking of the same Piezo1 iKO HFs captures eight hair follicles from P66 (the third hair cycle) to P267 (the 10th hair cycle). Forty HFs from two iKO animals were tracked for the study. Note the progressively shortened telogen in the later cycles. Scale bar, 100 μm. (G) Timeline of hair cycle stages for Piezo1 iKO HFs tracked by intravital microscopy.
Fig. 5.
Fig. 5.. Deletion of Piezo1 compromises mechanical properties of quiescent HF-SCs.
(A) Time series of scRNA-seq datasets from control and Piezo1 iKO samples. (B) Top five categories of Gene Ontology (GO) terms of down-regulated genes shared in 2- and 3-week Piezo1 iKO HF-SCs compared to the control. (C) Shared down-regulated genes in 2- and 3-week Piezo1 iKO HF-SCs are enriched in cell adhesion and actin filament organization categories. Red labeled genes indicate notable genes in these functions. (D) α6-Intergrin levels in bulge and HG are decreased in Piezo1 iKO 3 weeks after the deletion (ctrl, n = 51 cells; iKO, n = 45 cells; three pairs of animals). Scale bar, 10 μm. (E) Phalloidin staining reveals reduced stress fiber formation in bulge HF-SCs upon Piezo1 deletion (ctrl, n = 40 fibers; iKO, n = 46 fibers; three pairs of animals). Scale bars, 10 μm (top) and 5 μm (insert). (F) Nuclear YAP1 is not accumulated in Piezo1 iKO HFs 2 weeks after the deletion. Scale bars, 10 μm. (G) Increased nuclear YAP1 accumulation is observed in bulge HF-SCs and HGs 3 weeks after the deletion. Scale bar, 10 μm. (H) Quantification of YAP signals: 118 HF-SCs and 60 HG cells from three ctrl; 135 HF-SCs and 77 HG cells from three iKO. P values are calculated by Student’s t test for (D), (E), and (H). (I) Piezo1 iKO promotes the transition from the quiescent telogen phase to the activated anagen phase, determined by F-actin and nuclear YAP1 signals and modeling. (J) Stiffness of the bulge and HG in dorsal skin, measured by AFM, is reduced upon depletion of Piezo1. Ctrl, n = 4 HFs; iKO, n = 5 HFs. Ctrl: bulge mean = 1965.4 ± 736.0 Pa, HG mean = 1371.8 ± 491.6 Pa. Piezo1 iKO: bulge mean = 719.0 ± 239.3 Pa, HG mean = 1002.2 ± 491.6 Pa. P value is determined by Mann-Whitney U test.
Fig. 6.
Fig. 6.. PIEZO1 controls gene expression through transcription factor NFATC1.
(A) Top five GO terms of down-regulated genes in Nfatc1 cKO HF-SCs bulk RNA-seq data. (B) GO term analysis of commonly down-regulated genes in Nfatc1 cKO and Piezo1 iKO HF-SCs. (C) Gene lists of down-regulated NFATC1 targets involved in cell adhesion and actomyosin network in 3-week Piezo1 iKO HF-SCs. Red colored genes are only down-regulated in the 3-week sample but not in the 2-week sample. (D) Deletion of Piezo1 reduces NFATC1 nuclear localization in HF-SCs after 3 weeks (right) but not 2 weeks (left) after the induced deletion. Scale bar, 10 μm. (E) Quantification of NFATC1 and CD34 in bulge HF-SCs in control and Piezo1 iKO after 2- and 3-week treatment. A total of 113 bulge HF-SCs from three control mice and 85 bulge HF-SCs from 3 Piezo1 iKO mice after 2-week treatment and 74 bulge HF-SCs from three control mice and 122 bulge HF-SCs from 3 Piezo1 iKO mice after 3-week treatment are quantified for nuclear NFATC1. A total of 58 bulge HF-SCs from three control mice and 59 bulge HF-SCs from three Piezo1 iKO mice after 2-week treatment and 54 bulge HF-SCs from three control mice and 64 bulge HF-SCs from three Piezo1 iKO mice after 3-week treatment are quantified for CD34. Each dot in the violin plot represents normalized value in each cell for nuclear NFATC1 or CD34, respectively. Dots in box plot show normalized mean intensity of nuclear NFATC1 or CD34 from each animal, respectively. P values are calculated by Student’s t test. (F) NFATC1-dependent genes are progressively down-regulated from 2 to 3 weeks after deletion in Piezo1 iKO HF-SCs. Statistical significance was determined by Wilcoxon rank sum test (***P < 0.001).
Fig. 7.
Fig. 7.. PIEZO1 regulates the expression of cell adhesion and actin genes through AP1 transcription factors.
(A) Schematics for identifying transcription factors downstream of PIEZO1 by using scRNA-seq and scATAC-seq datasets. (B) Highly enriched transcription factor motifs within ±10 kb of the TSS of down-regulated genes in Piezo1 KO HF-SCs. (C) c-Jun nuclear localization is reduced in the bulge, marked by CD34, after 3-week induction of Piezo1 deletion. Scale bars, 20 μm. (D) mRNA levels of Fosl1 but not c-Jun are progressively decreased in HF-SCs in Piezo1 iKO as determined by scRNA-seq (***P < 0.001, ns, not significant). (E) Top four GO terms of predicted AP1 targets in HF-SCs. (F to I) IGV track of HF-SC bulk ATAC-seq, HF-SC scATAC-seq, and AP1 CUT&RUN data in the loci of Actn1 (F), Itga6 (G), Myh9 (H) and Piezo1 (I). Blue box indicates the TSS, green box indicates the c-Jun binding, and arrow indicates the direction of the transcription. (J) Representative gene lists of down-regulated AP1 targets that are highly enriched in cell junction, adhesion, and actin cytoskeleton categories in Piezo1 iKO HF-SCs after 3 weeks of induced deletion.
Fig. 8.
Fig. 8.. The transcriptional network downstream of PIEZO1-mediated calcium influx reinforcing quiescence and mechanical properties of HF-SCs.
(A) IGV track of HF-SC bulk ATAC-seq, HF-SC scATAC-seq, and c-Jun CUT&RUN data in Klf6 locus. Blue and green boxes indicate the TSS and c-Jun binding, respectively. An inactive noncoding RNA is located upstream of the TSS of Klf6. (B) mRNA levels of Klf6 are progressively reduced in HF-SCs in 2-week and 3-week Piezo1 iKO scRNA-seq datasets (***P < 0.001). (C) KLF6 levels are decreased in Piezo1 iKO bulge. Scale bars, 10 μm. (D) Predicted KLF6 targets show significant enrichment in the categories of cell adhesion and actin filament. Red colored genes are also targeted by c-Jun/AP1. (E) THBS1 proteins are reduced in the bulge and HG 3 weeks after induced Piezo1 deletion. Scale bars, 10 μm. (F) Quantification of THBS1 signals in bulge HF-SCs and HG cells in control and Piezo1 iKO (left) and quantification of E-cadherin signals in bulge HF-SCs (right). A total of 178 bulge HF-SCs and 63 HG cells from three control mice and 145 bulge HF-SCs and 68 HG cells from 3 Piezo1 iKO mice are quantified for THBS1. A total of 60 bulge HF-SCs from three control mice and 48 bulge HF-SCs from three Piezo1 iKO mice are quantified for E-cadherin. Each dot in the violin plot represents normalized value for THBS1 in each cell. Dots in box plot show normalized mean intensity of THBS1 or E-cadherin from each animal. P values are calculated by Student’s t test. (G) Venn diagram of AP1, NFATC1, and KLF6 targets in Piezo1 KO HF-SCs. (H) Model of PIEZO1-mediated calcium influx controlled by the force from E-cadherin reinforcing quiescence and mechanical properties of HF-SCs through the regulation of ECM, cell adhesion, and actin cytoskeleton by transcription factors AP1, NFATC1, and KLF6.

References

    1. Engler A. J., Sen S., Sweeney H. L., Discher D. E., Matrix elasticity directs stem cell lineage specification. Cell 126, 677–689 (2006). - PubMed
    1. Vining K. H., Mooney D. J., Mechanical forces direct stem cell behaviour in development and regeneration. Nat. Rev. Mol. Cell Biol. 18, 728–742 (2017). - PMC - PubMed
    1. Kim S., Uroz M., Bays J. L., Chen C. S., Harnessing mechanobiology for tissue engineering. Dev. Cell 56, 180–191 (2021). - PMC - PubMed
    1. Hoffman B. D., Grashoff C., Schwartz M. A., Dynamic molecular processes mediate cellular mechanotransduction. Nature 475, 316–323 (2011). - PMC - PubMed
    1. Janmey P. A., Fletcher D. A., Reinhart-King C. A., Stiffness sensing by cells. Physiol. Rev. 100, 695–724 (2020). - PMC - PubMed