. 2025 May 30;11(22):eadu9512.
doi: 10.1126/sciadv.adu9512. Epub 2025 May 28.

Mitochondrial calcium signaling regulates branched-chain amino acid catabolism in fibrolamellar carcinoma

Affiliations

Mitochondrial calcium signaling regulates branched-chain amino acid catabolism in fibrolamellar carcinoma

Nicole M Marsh et al. Sci Adv. .

Abstract

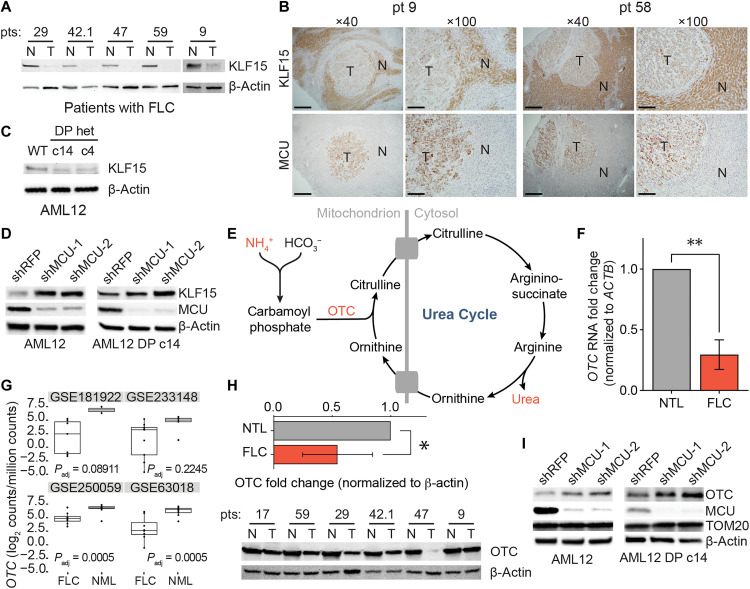
Metabolic adaptations are essential for survival. The mitochondrial calcium uniporter plays a key role in coordinating metabolic homeostasis by regulating mitochondrial metabolic pathways and calcium signaling. However, a comprehensive analysis of uniporter-regulated mitochondrial pathways has remained unexplored. Here, we investigate consequences of uniporter loss and gain of function using uniporter knockout cells and fibrolamellar carcinoma (FLC), which we demonstrate to have elevated mitochondrial calcium levels. We find that branched-chain amino acid (BCAA) catabolism and the urea cycle are uniporter-regulated pathways. Reduced uniporter function boosts expression of BCAA catabolism genes and the urea cycle enzyme ornithine transcarbamylase. In contrast, high uniporter activity in FLC suppresses their expression. This suppression is mediated by the transcription factor KLF15, a master regulator of liver metabolism. Thus, the uniporter plays a central role in FLC-associated metabolic changes, including hyperammonemia. Our study identifies an important role for the uniporter in metabolic adaptation through transcriptional regulation of metabolism and elucidates its importance for BCAA and ammonia metabolism.


Figures

Fig. 1.
Fig. 1.. MCU KO cells exhibit growth defects and altered mitochondrial proteome.
(A) WT, MCU KO, and MCU rescue (resc) cells were counted on days 2, 3, and 5 after plating; n = 4 to 6. (B) HeLa cell doubling times were calculated from cell counts on days 2 and 5 in (A); statistical significance was determined by Dunnett’s multiple comparisons test following one-way analysis of variance (ANOVA); expression of MCU and MCU-FLAG was confirmed by Western blot. (C) Volcano plot shows relative abundance of mitochondrial proteins in MCU KO cells compared to those in WT cells. Red points indicate proteins in the valine, leucine, and isoleucine degradation Kyoto Encyclopedia of Genes and Genomes (KEGG) pathway; n = 5. (D) Volcano plot shows relative abundance of mRNAs encoding mitochondrial proteins in MCU KO cells compared to those in WT cells. Red points indicate genes in the valine, leucine, and isoleucine degradation KEGG pathway; MCU is marked in light blue; n = 3. RNA-seq, RNA sequencing. (E and F) Fold change (FC) of valine, leucine, and isoleucine degradation-associated proteins (E) and genes (F) enriched in MCU KO cells in (C) and (D), respectively; proteins and genes are listed in order of ascending P value. All error bars represent SD; n.s., not significant; **P < 0.01; ***P < 0.001; ****P < 0.0001. n indicates the number of biological replicates.
Fig. 2.
Fig. 2.. Mitochondrial calcium uniporter regulates BCAA catabolism pathway.
(A) Representative immunoblots of select BCAA catabolism proteins and uniporter components and their quantification in HeLa WT and MCU KO cells; n = 3. (B) Representative immunoblots of select BCAA catabolism pathway proteins and their quantification in HeLa WT and EMRE KO cells; n = 3. (C) Representative immunoblots of select BCAA pathway proteins and their quantification in AML12 cells following shRNA-mediated MCU KD; n = 3. (D) Schematic of BCAA catabolism pathway. The committed step in the pathway is catalyzed by the BCKDH complex which is active in the dephosphorylated state. (E) Representative immunoblots of phosphorylated and total BCKD-E1α in HeLa WT, MCU KO and EMRE KO cells. (F) Representative immunoblots of phosphorylated and total BCKD-E1α after MCU knockdown in HeLa cells. Statistical significance in (A) to (C) was determined by one-sample t test. All error bars represent SD; *P < 0.05; **P < 0.01. n indicates number of biological replicates.
Fig. 3.
Fig. 3.. BCAA catabolism maintains NADH/NAD+ balance in MCU KO cells.
(A) Cell numbers of WT and MCU KO cells with and without pharmacological activation of BCAA catabolism by BT2. Cells were counted 3 days after plating and treatment; n = 4 to 5. Immunoblots show phosphorylated and total BCKD-E1α after vehicle dimethyl sulfoxide (DMSO) or BT2 treatment. Statistical significance was determined by Dunnett’s multiple comparisons test following one-way ANOVA. (B) Schematic of BCAA catabolism and TCA cycle enzymes and metabolites; BCAA catabolism produces acetyl–coenzyme A (CoA) and succinyl-CoA, which can enter the TCA cycle; Ca2+-regulated enzymes and NAD+/NADH-coupled reactions are shown in red. Labeled leucine carbons (indicated as blue circles) and their incorporation into the TCA cycle are also shown. (C) Total abundance of indicated metabolites, including all isotopologs, relative to WT cells (left) and fractional isotopolog abundance for leucine catabolism-relevant isotopologs (right) from WT and MCU KO HeLa cells cultured in 13C6-labeled leucine for 2 hours; M+2 and M+6 indicate metabolites with 2 or 6 heavy carbons, respectively. (D) Relative NADH/NAD+ ratios in WT and MCU KO cells with and without 3 hours of BCAA starvation are shown. Statistical significance was determined by the Tukey-Kramer test following one-way ANOVA; n = 3. All error bars indicate SD; n.s., not significant; *P < 0.05; **P < 0.01; ***P < 0.001; ****P < 0.0001. n indicates number of biological replicates.
Fig. 4.
Fig. 4.. FLC is characterized by increased mitochondrial Ca2+ levels and uniporter expression.
(A) Schematic of FLC liver tumor with heterozygous deletion in chromosome 19 producing the DNAJ-PKAc (DP) fusion protein. This schematic was created in BioRender (N. Marsh, 2025; https://BioRender.com/up42cz5. (B) Immunoblots of lysates from non-tumor (N) and tumor (T) liver from patients with FLC show DP fusion protein expression in the tumor. (C) Electron micrographs at ×10,000 magnification of non-tumor (NTL) and tumor (FLC) sections from patient 9; nuclei are labeled n; scale bars, 1 μm. (D) Micrographs of samples shown in (C) at ×25,000 magnification; white arrowheads mark representative Ca2+ deposits in the tumor; scale bars, 600 nm. (E) Percentage of mitochondria from FLC patient 9 with Ca2+ deposits; the mean is reported from manual counting of >500 mitochondria per sample by two independent, blinded analysts. (F) Immunoblots of uniporter components and control mitochondrial proteins from paired non-tumor (N) and FLC tumor (T) samples. (G) Pooled quantification of immunoblots in (F) normalized to TOM20 levels; statistical significance was determined by one-sample t test. (H) Hematoxylin and eosin (H&E) and MCU immunohistochemistry (IHC) staining of non-tumor (N) and tumor (T) regions of liver from FLC patient 9; ×40 and ×100 image scale bars are 500 and 200 μm, respectively. (I) qPCR analysis of MCU RNA expression in paired NTL and tumors from FLC patients 29, 42.1, 47, and 59. (J) MCU transcript expression in indicated datasets in tumor (FLC) and normal liver (NML). All error bars indicate SD; numbers above error bars indicate P values; *P < 0.05.
Fig. 5.
Fig. 5.. Cellular models of FLC show DP-dependent increase in mitochondrial Ca2+ levels.
(A) Immunoblot of lysates from WT and FLC clones c14 and c4 using an antibody against PKAc. (B) Proliferation curves of cellular models of FLC compared to those of WT AML12 cells; cells were counted on days 2, 3, and 4 after plating; n = 3. (C) Representative traces and quantification of mitochondrial Ca2+ released after CCCP addition in AML12 cells; statistical significance was determined by one-sample t test; n = 3. (D) Representative trace of mitochondrial free Ca2+ levels of AML12 WT and c14 cells quantified using matrix-targeted Ca2+ reporter G-GECO (mito-G-GECO). (E) Baseline mito-G-GECO fluorescence normalized to minimum and maximum signals in AML12 cells; statistical significance was determined by Mann-Whitney test; n = 3 (F and G) Representative traces (F) and mitochondrial Ca2+ uptake rates (G) in AML12 cells; mitochondrial Ca2+ uptake rates were calculated by monitoring Ca2+ clearance in the presence of a Ca2+ indicator dye; statistical significance was determined by one-sample t test; n = 3. Immunoblot of MCU in FLC clones compared to that in WT controls. (H) Mitochondrial Ca2+ release was assayed as in (C) after cells were treated with 5 μM PKA inhibitor BLU2864 or DMSO for 4 days. Ca2+ release was normalized to total protein levels; fold change in released Ca2+ is shown relative to DMSO control for each cell line; statistical significance was determined by paired t test, n = 3. (I) Seahorse extracellular flux analysis of OCRs in FLC clones compared to those in WT AML12 cells at baseline and after indicated treatments; n = 2 (five to eight technical replicates each). All error bars indicate SD; n.s., not significant; *P < 0.05; **P < 0.01; ***P < 0.001; ****P < 0.0001. n indicates the number of biological replicates.
Fig. 6.
Fig. 6.. FLC is characterized by uniporter-mediated suppression of BCAA catabolism.
(A) Analysis of publicly available gene expression datasets of FLC tumor and normal liver show decreases in BCAA catabolism gene expression in FLC. (B) Immunoblots of select BCAA catabolism enzymes from paired non-tumor (N) and FLC tumor (T) lysates and pooled quantification of protein levels normalized to TOM20 levels; statistical significance was determined by one-sample t test. (C) Immunoblots and quantification of select BCAA catabolism proteins and uniporter components in AML12 cells; statistical significance was determined by one-sample t test; n = 4. (D) MCU KD increases expression of BCAA catabolism pathway proteins in FLC clones; immunoblots of select pathway proteins and uniporter components are shown. (E) Growth of AML12 cells with or without BCAT2 expression, grown in medium with varying BCAA levels; statistical significance was determined by two-way ANOVA, n = 2 (three technical replicates each). Immunoblot of BCAT2 confirms its expression. (F) Growth of FLX1 under indicated conditions; statistical significance was determined by Šídák’s multiple comparisons test, n = 2. Immunoblot shows DP expression in FLX1 lysates and tumor (T) but not in non-tumor (N) liver lysates from a patient with FLC. All error bars indicate SD; *P < 0.05; **P < 0.01; ***P < 0.001. n indicates the number of biological replicates.
Fig. 7.
Fig. 7.. KLF15 and OTC expression are regulated by the uniporter in FLC.
(A) Immunoblots of KLF15 in paired non-tumor (N) and FLC tumor (T) lysates. (B) IHC of MCU and KLF15 on non-tumor (N) and tumor (T) regions from FLC patients 9 and 58; ×40 and ×100 image scale bars are 500 and 200 μm, respectively. (C) Immunoblot of KLF15 from WT AML12, c14, and c4 lysates. (D) Immunoblots of KLF15 from WT AML12 and c14 lysates following MCU KD. (E) Schematic of the urea cycle metabolites and OTC, a mitochondrial protein with reduced levels in FLC. (F) qPCR analysis of OTC mRNA expression in paired NTL and tumors from FLC patients 29, 42.1, 47, and 59; statistical significance was determined by one sample t test; n = 4 (G) OTC mRNA expression in normal liver (NML) and FLC tumors in the indicated gene expression datasets. (H) Immunoblot of OTC and quantification of OTC levels relative to β-actin from paired non-tumor (N) and FLC tumor (T) lysates; statistical significance was determined by one sample t test; n = 5. (I) Immunoblots of OTC from WT AML12 and c14 lysates following MCU KD. All error bars indicate SD; *P < 0.05; **P < 0.01. n indicates the number of biological replicates.
Fig. 8.
Fig. 8.. Model for regulation of KLF15, BCAAs, and the urea cycle by mitochondrial Ca2+ signaling.
Our data suggest that, under conditions of low uniporter function, high KLF15 levels stimulate expression of BCAA catabolism pathway genes and OTC. Activation of this pathway helps maintain NADH/NAD+ balance. Increased uniporter activity, as observed in FLC, inhibits KLF15, leading to decreased BCAA catabolism enzyme and OTC expression. This inhibition conserves BCAAs for translation and cell growth. MCU inhibition also causes urea cycle impairment, which can lead to hyperammonemia. How the uniporter regulates KLF15 expression is not known. This diagram was created in BioRender (N. Marsh, 2025; https://BioRender.com/akf16h3).

Update of

Similar articles

Cited by

References

    1. Balderas E., Eberhardt D. R., Lee S., Pleinis J. M., Sommakia S., Balynas A. M., Yin X., Parker M. C., Maguire C. T., Cho S., Szulik M. W., Bakhtina A., Bia R. D., Friederich M. W., Locke T. M., van Hove J. L. K., Drakos S. G., Sancak Y., Tristani-Firouzi M., Franklin S., Rodan A. R., Chaudhuri D., Mitochondrial calcium uniporter stabilization preserves energetic homeostasis during complex I impairment. Nat. Commun. 13, 2769 (2022). - PMC - PubMed
    1. Gherardi G., Nogara L., Ciciliot S., Fadini G. P., Blaauw B., Braghetta P., Bonaldo P., de Stefani D., Rizzuto R., Mammucari C., Loss of mitochondrial calcium uniporter rewires skeletal muscle metabolism and substrate preference. Cell Death Differ. 26, 362–381 (2019). - PMC - PubMed
    1. Huo J., Molkentin J. D., MCU genetically altered mice suggest how mitochondrial Ca2+ regulates metabolism. Trends Endocrinol. Metab. 35, 918–928 (2024). - PMC - PubMed
    1. Kwong J. Q., Huo J., Bround M. J., Boyer J. G., Schwanekamp J. A., Ghazal N., Maxwell J. T., Jang Y. C., Khuchua Z., Shi K., Bers D. M., Davis J., Molkentin J. D., The mitochondrial calcium uniporter underlies metabolic fuel preference in skeletal muscle. JCI Insight 3, e121689 (2018). - PMC - PubMed
    1. Tomar D., Elrod J. W., Metabolite regulation of the mitochondrial calcium uniporter channel. Cell Calcium 92, 102288 (2020). - PMC - PubMed

MeSH terms

Substances

Supplementary concepts