. 2025 May 28;16(1):4945.
doi: 10.1038/s41467-025-59901-0.

WNK1 mediates M-CSF-induced macropinocytosis to enforce macrophage lineage fidelity

Affiliations

WNK1 mediates M-CSF-induced macropinocytosis to enforce macrophage lineage fidelity

Alissa J Trzeciak et al. Nat Commun. .

Abstract

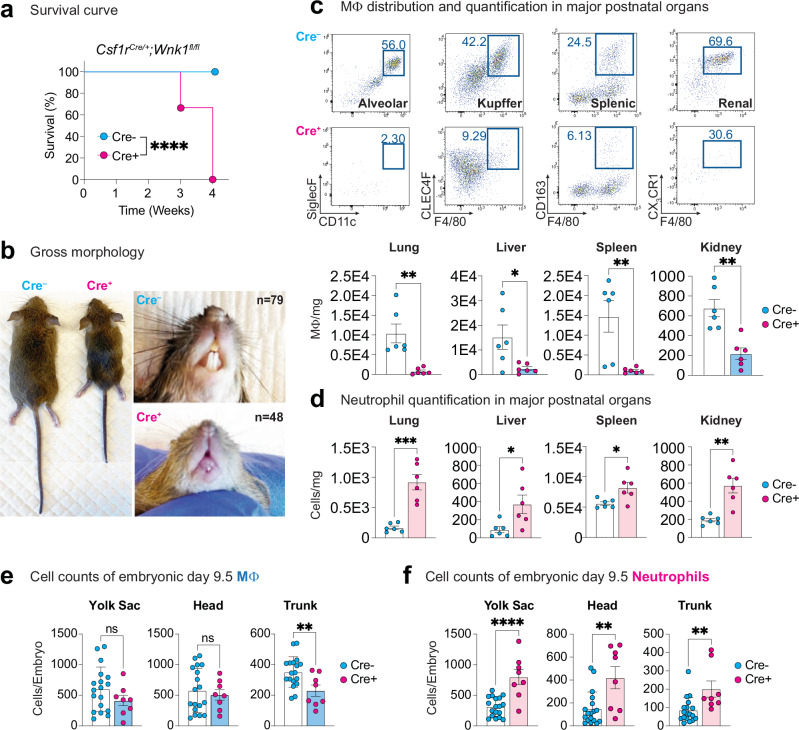
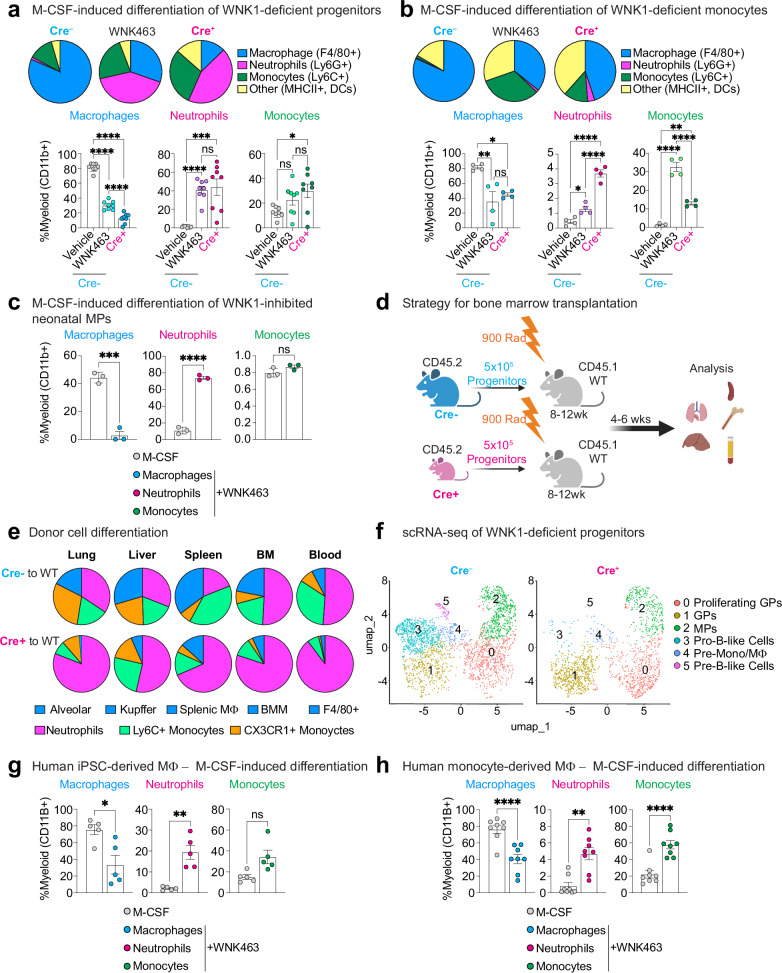
Tissue-resident macrophages (TRM) are critical for mammalian organismal development and homeostasis. Here we report that with-no-lysine 1 (WNK1) controls myeloid progenitor fate, with Csf1riCre-mediated Wnk1 deletion in mice (WNK1-deficient mice) resulting in loss of TRMs and causing perinatal mortality. Mechanistically, absence of WNK1 or inhibition of WNK kinase activity disrupts macrophage colony-stimulating factor (M-CSF)-stimulated macropinocytosis, thereby blocking mouse and human progenitor and monocyte differentiation into macrophages and skewing progenitor differentiation into neutrophils. Treatment with PMA rescues macropinocytosis but not macrophage differentiation of WNK-inhibited progenitors, implicating that M-CSF-stimulated, macropinocytosis-induced activation of WNK1 is required for macrophage differentiation. Finally, M-CSF-stimulated macropinocytosis triggers WNK1 nuclear translocation and concomitant increased protein expression of interferon regulatory factor (IRF)8, whereas inhibition of macropinocytosis or WNK kinase activity suppresses IRF8 expression. Our results thus suggest that WNK1 and downstream IRF8-regulated genes are important for M-CSF/macropinocytosis-mediated regulation of myeloid cell lineage commitment during TRM development and homeostasis.


Conflict of interest statement

Competing interests: J.S.A.P. holds patents related to imaging and modulation of cellular metabolism stemming from this work and is a co-founder of Atish Technologies. All other authors have no competing interests to disclose.

Figures

Fig. 1
Fig. 1. Csf1riCre-mediated deletion of Wnk1 results in rapid mortality, MΦ deficiency, and neutrophilia.
a Csf1riCre-mediated deletion of WNK1 results in early mortality. Survival curve of Csf1rCre+; Wnk1fl/fl (Cre + , magenta) vs. Csf1Cre–; Wnk1fl/fl (Cre-, blue) mice. Litters were monitored from birth and sacrificed humanely when failure to thrive criteria were met. Data are from n = 74 Cre- mice and n = 48 Cre+ mice. Differences in survival were determined using the Mantel-Cox test. ****p < .0001. b Analysis of gross morphology reveals severe underdevelopment. Representative images of three- to four-week-old Cre- and Cre+ mice body (top) and teeth (bottom). Images are representative of n = 74 Cre− mice and n = 48 Cre+ mice. (Right) Representative images of organs from Cre− to Cre+ mice. Shown are (clockwise from top left) brain, spleen, colon, kidneys, bones, liver, heart, and lungs. Images are representative of organ analysis from six Cre− mice and six Cre+ mice. See Supplementary Fig. 1 for additional gross morphology and organ size analysis. c Flow cytometric analysis of macrophage subsets in major organs. Flow cytometry analysis of CD45+ tissue-resident macrophages in Cre+ (n = 6, magenta dots) and Cre− (n = 6, blue dots) 3-to-4-week-old mice. Subsets were first gated on live CD45+ CD11c− CD11b+ (except for lung macrophages; see Supplementary Fig. 2a for flow cytometry gating strategy). Tissue-resident macrophages were gated as follows: alveolar macrophage (CD11chigh CD11blow SiglecF+), Kupffer cells (Ly6C− Ly6G− CLEC4F+ F4/80+), splenic red pulp macrophages (Ly6C− Ly6G− CD163+ F4/80+), and kidney macrophages (Ly6C− Ly6G− CX3CR1+ F4/80+). Images (top) and summary plots (bottom) of absolute numbers per milligram of tissue are from four independent experiments. Data are shown as mean ± SEM. Statistical significance was determined via two-tailed independent samples t-test. *p < .05, **p < .01. See also Supplementary Fig. 2b, c for analysis of additional tissues and Supplementary Fig. 3 for immunofluorescence (IF) analysis. d Flow cytometric analysis of neutrophilia in major organs. Flow cytometry analysis of neutrophils (Ly6G+) in major tissues from Cre+ (n = 6, magenta dots) and Cre− (n = 6, blue dots) 3-to-4-week-old mice (see Supplementary Fig. 2a for flow cytometry gating strategy). Shown are summary plots of absolute numbers per milligram of tissue from four independent experiments. Statistical significance was determined via two-tailed independent samples t-test. *p < .05, **p < .01, ***p < .001. See also Supplementary Fig. 2e–h for analysis of additional tissues, Supplementary Fig. 3 for IF analysis, and Supplementary Fig. 4 for morphological and functional analysis of Cre− and Cre+ neutrophils. e, f Flow cytometric analysis of embryonic macrophages and neutrophils in E9.5 embryos. Eight pregnant dams were euthanized at E9.5, and embryos were isolated, genotyped, and analyzed. Shown are summary plots of the absolute counts from flow cytometry analysis of CD11bLow F4/80+ macrophages (e) and CD11bHigh Ly6C+ Ly6G+ fetal neutrophils (f) in Cre− (n = 18, blue dots) and Cre+ (n = 8, magenta dots) E9.5 embryos. Yolk sac (left), head (middle), and trunk (right) were separated to delineate yolk sac-derived and brain-derived macrophages from tissue-resident macrophages in other organs. Pooled data are from eight independent experiments with between two and six biological replicates per experiment. Data are shown as mean ± SEM. Statistical significance was determined via two-tailed independent samples t-test. **p < .01, ****p < .0001, ns = not significant. See also Supplementary Figs. 2a and 6a, b for flow cytometry gating strategy and Supplementary Fig. 6c–h for analysis of E9.5 erythromyeloid progenitors and monocytes. Source data are provided in a Source Data file included with this manuscript.
Fig. 2
Fig. 2. WNK1 links M-CSF signaling and macrophage differentiation.
a Analysis of lineage frequency in M-CSF-treated mouse bone marrow myeloid progenitors. Bone marrow myeloid progenitors were isolated from Csf1rCre+; Wnk1fl/fl (KO, n = 8), Csf1Cre–; Wnk1fl/fl treated with the WNK kinase activity inhibitor, WNK463 (+WNK463, n = 8), or Csf1Cre–; Wnk1fl/fl (M-CSF, n = 8) mice and treated with M-CSF for 4 d. Cultures were subsequently analyzed for the presence of macrophages, monocytes, neutrophils, and dendritic cells (DCs). See Supplementary Fig. 2a for flow cytometry gating strategy. Live cells were first gated as CD45+ CD11b+. (Top) Shown are fraction of the whole pie charts of neutrophils (Ly6G+ Ly6C+ F4/80−; magenta), monocytes (Ly6G− F4/80− Ly6C+; green), macrophages (Ly6C− Ly6G− F4/80+; blue), and other/DCs (F4/80− MHC Class II+; yellow). (Bottom) Shown are summary graphs of the above-identified populations. Data are representative of three independent experiments. Summary plots are shown as mean ± SEM. Statistical significance was assessed via one-way ANOVA. *p < .05, ***p < .001, ****p < .0001, ns = not significant. b Analysis of lineage frequency in M-CSF-treated mouse bone marrow Ly6C+ monocytes. Bone marrow Ly6C+ monocytes were isolated from Csf1rCre+; Wnk1fl/fl (KO, n = 3), Csf1Cre–; Wnk1fl/fl treated with WNK463 (+WNK463, n = 4), or Csf1Cre–; Wnk1fl/fl (M-CSF, n = 4) mice and treated with M-CSF for 4 d. Cultures were subsequently analyzed for the presence of macrophages, monocytes, neutrophils, and dendritic cells (DCs). See Supplementary Fig. 2a for flow cytometry gating strategy. Live cells were first gated as CD45+ CD11b+. (Top) Shown are fraction of the whole pie charts of neutrophils (Ly6G+ Ly6C+ F4/80−; magenta), monocytes (Ly6G− F4/80− Ly6C+; green), macrophages (Ly6C- Ly6G− F4/80+; blue), and other/DCs (F4/80− MHC Class II+; yellow). (Bottom) Shown are summary graphs of the above-identified populations. Data are representative of three independent experiments. Summary plots are shown as mean ± SEM. Statistical significance was assessed via one-way ANOVA. *p < .05, **p < .01, ***p < .001, ****p < .0001. c Analysis of lineage frequency in M-CSF-treated mouse neonatal myeloid progenitors. Wildtype mouse neonatal myeloid progenitors (MPs) were treated with M-CSF in the presence of vehicle or WNK463 for 3 d. Cultures were subsequently analyzed for the presence of macrophages, monocytes, and neutrophils. See Supplementary Fig. 2a for flow cytometry gating strategy. Live cells were first gated as CD45+ CD11b+, then gated for neutrophils (Ly6G+ Ly6C+ F4/80−; magenta), monocytes (Ly6G− F4/80− Ly6C+; green), and macrophages (Ly6C− Ly6G− F4/80+; blue). Shown are summary graphs of the above-identified populations. Data are representative of four independent experiments. Summary plots are shown as mean ± SEM. Statistical significance was assessed via two-tailed independent samples t-test. ***p < .001, ****p < .0001, ns = not significant. d, e Transplantation of Cre- or Cre+ bone marrow myeloid progenitors into adult wildtype hosts. d Schematic of experimental strategy. Bone marrow myeloid progenitors from Cre− to Cre+ mice were transplanted into congenically labeled, lethally irradiated (900 rad) adult wildtype (WT) recipient mice, then analyzed 4–6 weeks post-transplant. e Shown is the frequency of macrophages (blue), neutrophils (magenta), Ly6C+ monocytes (green), and CX3CR1+ monocytes (orange) arising from Cre− (Cre− to WT) and Cre+ (Cre+ to WT) donor progenitors across tissues analyzed. See Supplementary Fig. 2a for flow cytometry gating strategy. Data are from two independent experiments with six (Cre+) or four (Cre−) mice per group. f Single cell RNA sequencing analysis of multipotent progenitor (MPP)3 cells. MPP3 cells (Lin− cKit+ Sca-1+ Flt3− CD150− CD48+) were flow cytometry sorted from Csf1Cre–; Wnk1fl/fl (Cre-, n = 3) and Csf1rCre+; Wnk1fl/fl (Cre+, n = 4) neonatal bone marrow, labeled with barcoded MHC Class I-specific antibodies, and processed for scRNAseq. Shown is the dimension reduction analysis of MPP3 cells from Cre− mice using UMAP with overlayed analysis of Cre+ MPP3s. g Perturbation of WNK kinase activity prevents differentiation of human myeloid progenitors into mature macrophages. Shown are summary plots of myeloid subsets from experiments performed as detailed in Supplementary Fig. 11a using human pluripotent stem cell-derived myeloid progenitors. Pooled data are from four independent experiments with one-to-two biological replicates (unique donors; n = 5 per group) per experiment. Data are shown as mean ± SEM. Statistical significance was determined via two-tailed independent samples t-test. *p < .05, **p < .01, ns = not significant. See also Supplementary Fig. 12a for flow cytometry characterization of cell-surface proteins. h Perturbation of WNK kinase activity blocks differentiation of human monocytes into mature macrophages. Shown are summary plots of myeloid subsets from experiments performed as detailed in Supplementary Fig. 11g using human blood monocytes. Pooled data are from four independent experiments with two biological replicates (unique male and female donors) per experiment. Data are shown as mean ± SEM. Statistical significance was determined via two-tailed independent samples t-test. **p < .01, ***p < .001. See also Supplementary Fig. 12b for flow cytometry characterization of cell-surface proteins. Source data are provided in a Source Data file included with this manuscript. Created in BioRender. Perry, J. (2025) https://BioRender.com/mxpjzhx.
Fig. 3
Fig. 3. M-CSF stimulates macropinocytosis in myeloid progenitors in a WNK kinase activity-dependent manner.
a Myeloid progenitors perform macropinocytosis in response to M-CSF. (Left) Representative images of myeloid progenitors incubated with M-CSF and 70kDa-florescent Dextran (magenta). Nuclei were stained with Hoechst (yellow) and the plasma membrane was labeled using CellMask (cyan), then myeloid progenitors were imaged at 100X magnification for 30 min. Scale bar, 2 μm. (Right) Quantitation of 70 kDa Dextran uptake per cell via geometric mean fluorescence intensity (MFI) at t = 0 and 30 min. Data is representative of four independent experiments, n = 8 per time point. Statistical significance was determined via two-tailed paired samples t-test. **p < .01. b Inhibition of WNK kinase activity or macropinocytosis blocks M-CSF-stimulated internalization of 70 kDa Dextran by myeloid progenitors. Experiments were performed as in (a) using myeloid progenitors. (Left) Representative images of myeloid progenitors treated with M-CSF and either WNK463 or EIPA. Scale bar, 2 μm. (Right) Quantitation of 70 kDa Dextran uptake per cell via MFI after 30 min. Data are from four independent experiments. Each dot represents the average MFI per field of view (n = 10 per group). Data are shown as mean ± SEM. Statistical significance was determined via two-tailed independent samples t-test. **p < .01, ****p < .0001. c M-CSF-stimulated internalization of 70 kDa Dextran is lost in WNK1-deficient myeloid progenitors. Experiments were performed as in (a) using bone marrow myeloid progenitors from Csf1rCre+; Wnk1fl/fl (Cre+) or Csf1Cre–; Wnk1fl/fl (Cre−) mice. Shown is the quantitation of 70 kDa Dextran uptake via MFI per cell. Data is from four independent experiments with two-three mice (biological replicates) per experiment (n = 5 per condition). Statistical significance was determined via two-tailed independent samples t-test. ****p < .0001. d, e WNK1 boosts M-CSF-stimulated macropinocytosis in myeloid progenitors. Experiments were performed as in (a) using bone marrow myeloid progenitors overexpressing WNK1-mRuby. Shown are confocal microscopy (d) and flow cytometry (e) analysis of 70 kDa Dextran uptake. Data is from four independent experiments. Data are shown as mean ± SEM. Statistical significance was determined via two-tailed independent samples t-test. ***p < .001. f, g Confocal microscopy analysis of WNK1 protein expression and macropinocytosis in M-CSF-treated granulocyte and monocyte progenitors. f (Left) Representative fixed images of granulocyte progenitors (GPs, orange) sorted from WT animals based on Lin− cKit+ Sca-1− CD34+ CD64High Ly6C+ CSF1RLow or macrophage/monocyte progenitors (MPs, purple) sorted based on Lin− cKit+ Sca-1− CD34+ CD64High Ly6C+ CSF1RHigh. See Supplementary Fig. 2a for flow cytometry gating strategy. Cells were stained with WNK1 antibody (magenta), plasma membrane dye (PM, blue), DAPI (green), and treated with 1 mg/mL 70 kDa Dextran (yellow), and 100 ng/mL M-CSF for 1 h. Scale bar, 5 μm (Right) Quantitation of WNK1 protein expression and 70 kDa Dextran uptake (g) via MFI per field view area (FOV = μm2). Data are from three independent experiments. n = 12 FOVs per group. Data are shown as mean ± SEM. Statistical significance was determined via two-tailed independent samples t-test. **p < .01, ***p < .001. Source data are provided in a Source Data file included with this manuscript.
Fig. 4
Fig. 4. M-CSF stimulates macropinocytosis in myeloid progenitors in a WNK kinase activity-dependent manner.
a Perturbation of macropinocytosis skews M-CSF-stimulated bone marrow myeloid progenitor differentiation from monocytes/macrophages to neutrophils. Bone marrow myeloid progenitors were isolated and differentiated with M-CSF in the presence of vehicle or EIPA for 4 d. See Supplementary Fig. 2a for flow cytometry gating strategy. Shown are summary plots of flow cytometry analysis for macrophages (F4/80+) and neutrophils (Ly6G+). Data are presented as a frequency of myeloid cells (CD11b+, left graphs) or total cell counts per well (right graphs) from three independent experiments with two mice per experiment. Data are shown as mean ± SEM. Statistical significance was determined via two-tailed independent samples t-test. *p < .05, **p < .01, ****p < .0001. See also Supplementary Fig. 16a for cell viability analysis. b Perturbation of macropinocytosis skews M-CSF-stimulated mouse neonatal myeloid progenitor differentiation from macrophages to neutrophils. Mouse embryonic stem cell-derived myeloid progenitors were differentiated with M-CSF in the presence of vehicle or EIPA for 4 d. Shown are summary plots of flow cytometry analysis for macrophages (F4/80+) and neutrophils (Ly6G+). Data are presented as a frequency of myeloid cells (CD11b+, left graphs) or total cell counts per well (right graphs) from three independent experiments. See Supplementary Fig. 2a for flow cytometry gating strategy. Data are shown as mean ± SEM. Statistical significance was determined via two-tailed independent samples t-test. *p < .05, **p < .01, ****p < .0001. See also Supplementary Fig. 16b for cell viability analysis. c Perturbation of macropinocytosis skews M-CSF-stimulated human myeloid progenitor differentiation from macrophages to neutrophils in a dose-dependent manner. Human myeloid progenitors were differentiated with M-CSF in the presence of vehicle or EIPA at indicated concentrations for 4 d. Shown are summary plots of flow cytometry analysis for macrophages (CD11B+, CD14Low, CD16High, CSF1R+, CD206+, and CD86+) and neutrophils (CD11B+, CD14Low, CD15+, and CD66B+). See Supplementary Fig. 2a for flow cytometry gating strategy. Data are presented as a frequency of myeloid cells (CD11B+) from three independent experiments (n = 6 per condition). Data are shown as mean ± SEM. Statistical significance was determined via one-way ANOVA. **p < .01, ***p < .001, ****p < .0001, ns = not significant. See also Supplementary Fig. 16c, d for cell viability analysis. d WNK1 overexpression enhances differentiation of myeloid progenitors in response to M-CSF. Experiments were performed as in (a), but with wildtype cells overexpressing functional WNK1-mRuby (see Fig. 3d, e for functional analysis) and analysis performed after 24 h. Shown are summary plots of flow cytometry analysis for macrophages (F4/80 + ). Data are presented as a frequency of myeloid cells (CD11b+, left graphs) or total cell counts per well (right graphs) from four independent experiments. See Supplementary Fig. 2a for flow cytometry gating strategy. Data are shown as mean ± SEM. Statistical significance was determined via two-tailed independent samples t-test. *p < .05, ***p < .001, ****p < .0001. e PMA-induced macropinocytosis does not correct aberrant differentiation in M-CSF-stimulated myeloid progenitors treated with WNK463. Experiments were performed as in (c), but with the inclusion of PMA treatment, which induces WNK kinase activity-independent macropinocytosis (Supplementary Fig. 16e, f). Shown are summary plots of flow cytometry analysis for macrophages (CD11B+, CD14Low, CD16High, CSF1R+, CD206+, and CD86+) and neutrophils (CD11B+, CD14Low, CD15+, and CD66B+). Data are presented as a frequency of myeloid cells (CD11B+) from four independent experiments. Data are shown as mean ± SEM. Statistical significance was determined via one-way ANOVA. ****p < .0001. Source data are provided in a Source Data file included with this manuscript.
Fig. 5
Fig. 5. Macropinocytosis induces CSF1R internalization in a WNK1-dependent manner.
a M-CSF-stimulated macropinocytosis induces phosphorylation of the WNK1 kinase region in bone marrow myeloid progenitors. Mouse myeloid progenitors were isolated from the bone marrow and stimulated with M-CSF in the presence of vehicle, WNK463, or indicated macropinocytosis inhibitors EIPA, Apilimod, and LY294002. Cells were harvested after 1 h, then assayed for WNK1 phosphorylation. Shown is a representative Phos-tag western blot (left) and quantitation of WNK1 phosphorylation (pWNK1; right). pWNK1 expression was normalized to loading control (β-actin, 42 kDa) and then calculated as a fold change (FC) of the pWNK1 bands (250 kDa) to a vehicle only (no M-CSF) control. Data are from two independent experiments with two biological replicates per condition/experiment. Data are shown as mean ± SEM. Statistical significance was determined via one-way ANOVA. *p < .05, **p < .01. b M-CSF-stimulated macropinocytosis induces phosphorylation of the WNK1 kinase region in human myeloid progenitors. Human iPSC-derived myeloid progenitors were stimulated with M-CSF in the presence of vehicle or WNK463 at the indicated concentrations, then assayed for WNK1 phosphorylation after 1 h. Shown is a representative Phos-tag western blot (left) and quantitation of WNK1 phosphorylation (pWNK1; right). pWNK1 levels were calculated and present as in (a). Data are pooled from two independent experiments with two biological replicates per condition/experiment. Data are shown as mean ± SEM. Statistical significance was determined via one-way ANOVA. **p < .01, ****p < .0001. c CSF1R is internalized in response to M-CSF stimulation in mouse myeloid progenitors. (Left) Representative images of bone marrow myeloid progenitors from Csf1rCre+; Wnk1fl/fl (Cre+) or Csf1Cre–; Wnk1fl/fl (Cre−) were incubated with 70 kDa Dextran (yellow) and M-CSF for 1 h. Then, cells were fixed and labeled with CSF1R (cyan), WNK1 (magenta), and DAPI (green). Scale bar, 5 μm. (Right) Quantitation of CSF1R protein internalization. Each dot represents the average MFI per field of view (FOV) divided by the number of cells per region, with n = 15 FOVs per group. Scale bar, 5 μm. The data shown is representative of four independent experiments. Data are shown as mean ± SEM. Statistical significance was determined via two-tailed independent samples t-test. ***p < .001, ns = not significant. d, e WNK1 translocates into the nucleus in response to M-CSF-stimulated macropinocytosis in a WNK kinase activity-dependent manner. WNK1 nuclear translocation analyzed via time-lapse confocal microscopy of WNK1-mRuby-expressing myeloid progenitors (d) or fixed-image confocal microscopy with a validated WNK1 antibody (e). In d, WNK1-mRuby-expressing myeloid progenitors were incubated with 70 kDa Dextran and M-CSF in the presence of vehicle or WNK463 and imaged over 1 h. In e, wildtype myeloid progenitors were incubated with 70 kDa Dextran and M-CSF in the presence of vehicle or EIPA for 1 h prior to fixation and analysis. Shown is a representative image (left) and summary plot (right) of WNK1 nuclear translocation. Quantitation was performed on 3D projections of each cell using Manders’ Overlap Coefficient (MCC%) with DAPI. Each dot represents the WNK1/DAPI MCC% overlap per cell, with n = 6 FOVs per group. Scale bar, 5 μm. Data are from four independent experiments. Data are shown as mean ± SEM. Statistical significance was determined via two-tailed independent samples t-test. ***p < .001. f M-CSF-stimulated macropinocytosis induces a WNK kinase activity-dependent increase in IRF8 protein expression in myeloid progenitors. Mouse bone marrow myeloid progenitors were stimulated with M-CSF in the presence of vehicle, WNK463, or EIPA. Cells were harvested after 24 h, then assayed via western blot for IRF8 protein expression. Shown is a representative western blot (left) and quantitation of IRF8 expression (right). IRF8 expression was normalized to loading control (Vinculin, 117 kDa) and then calculated as a fold change (FC) of the IRF8 band (48kD) to a vehicle only (no M-CSF) control. Data are from three independent experiments. Data are shown as mean ± SEM. Statistical significance was determined via one-way ANOVA. *p < .05, **p < .01. g, h WNK1 overexpression enhances IRF8 protein expression in response to M-CSF. Experiments were performed as in (f), but with wildtype cells overexpressing functional WNK1-mRuby (see Fig. 3d, e for functional analysis). IRF8 protein expression was assessed using orthogonal methods to improve sensitivity of detection: via intracellular flow cytometry (g) or via western blot (h). In g, shown are representative images (left) and quantitation of the geometric mean fluorescence intensity of IRF8 (right). In h, shown is a representative western blot (left) and quantitation of IRF8 expression (right). IRF8 expression was normalized to loading control (Vinculin, 117 kDa) and then calculated as a fold change (FC) of the IRF8 band (48 kDa) to a vehicle-only (no M-CSF) control. Data are from four independent experiments. Data are shown as mean ± SEM. Statistical significance was determined via one-way ANOVA (g) or two-tailed independent samples t-test (h). *p < .05, ****p < .0001, ns = not significant. Source data are provided in a Source Data file included with this manuscript.

References

    1. Zago, G., Saavedra, P. H. V., Keshari, K. R. & Perry, J. S. A. Immunometabolism of tissue-resident macrophages - an appraisal of the current knowledge and cutting-edge methods and technologies. Front. Immunol.12, 665782 (2021). - PMC - PubMed
    1. Morioka, S., Maueroder, C. & Ravichandran, K. S. Living on the edge: efferocytosis at the interface of homeostasis and pathology. Immunity50, 1149–1162 (2019). - PMC - PubMed
    1. Wynn, T. A., Chawla, A. & Pollard, J. W. Macrophage biology in development, homeostasis and disease. Nature496, 445–455 (2013). - PMC - PubMed
    1. Scott, C. L., Henri, S. & Guilliams, M. Mononuclear phagocytes of the intestine, the skin, and the lung. Immunol. Rev.262, 9–24 (2014). - PubMed
    1. Okabe, Y. & Medzhitov, R. Tissue biology perspective on macrophages. Nat. Immunol.17, 9–17 (2016). - PubMed

MeSH terms

Substances

Grants and funding

LinkOut - more resources