. 2025 May 28;16(1):4963.
doi: 10.1038/s41467-025-60044-5.

Basal ganglia deep brain stimulation restores cognitive flexibility and exploration-exploitation balance disrupted by NMDA-R antagonism

Affiliations

Basal ganglia deep brain stimulation restores cognitive flexibility and exploration-exploitation balance disrupted by NMDA-R antagonism

Nir Asch et al. Nat Commun. .

Abstract

Learning thrives on cognitive flexibility and exploration. Subjects with schizophrenia have impaired cognitive flexibility and maladaptive exploration patterns. The basal ganglia-dorsolateral prefrontal cortex (BG-DLPFC) network plays a significant role in learning processes. However, how this network maintains cognitive flexibility and exploration patterns and what alters these patterns in schizophrenia remains elusive. Using a combination of extracellular recordings, pharmacological manipulations, macro-stimulation techniques, and mathematical modeling, we show that in the nonhuman primate (NHP), the external segment of the globus pallidus (GPe, the central nucleus of the BG network) modulates cognitive flexibility and exploration patterns (experiments were done in females only). We found that chronic, low-dose administration of N-methyl-D-aspartate receptor (NMDA-R) antagonist, phencyclidine (PCP), decreases directed exploration but increases random exploration, as seen in schizophrenia. In line with adaptive working-memory reinforcement-learning models of the BG-DLPFC network, low-frequency GPe macro-stimulation restores the balance of both exploration types. Our findings suggest that exploration-exploitation imbalance reflects abnormal BG-DLPFC activity and that GPe stimulation may restore it.


Conflict of interest statement

Competing interests: The authors declare no competing interests.

Figures

Fig. 1
Fig. 1. Experimental setup and healthy behavioral performance.
a Top - MRI of the non-human primates’ (NHPs) brain and recording chamber. The red arrow points to the dorsolateral prefrontal cortex (DLPFC). Middle, extracellular recordings of DLPFC exemplary neuron (left) and 100 randomly chosen superimposed spike waveforms of the recorded cell (right). Bottom, Raster display and a post-stimulus time histogram (PSTH) of the neuron’s firing during 60 trials around choice selection (two seconds before and two seconds after). Bottom—The same as the top image, but for the external segment of the globus pallidus (GPe). b Top—Task design. NHPs had to identify the hidden association change and learn the new association. The first line represents an association change trial (AC) in which the NHP is unaware of the change of the new association and, therefore, chooses the wrong cue. The second line represents the next trial in the block in which the NHP changes its choice to another incorrect choice. In the third line, the NHP changes again, this time receiving a reward. The fourth line represents the following block, where the association changes without the NHPs’ knowledge. The NHP then chooses the same stimulus as before, but this time receives no reward. Bottom—A table showing the amount (and proportion) of recorded trial types for both brain regions. Rows indicate what happened in the previous trial (trial n) and columns indicate the current trial (n + 1). Text color coding indicates the fraction of recorded cells within each category of the total sum. For example, our neural data set of perseveration trials consists of 389 DLPFC and 700 GPe recordings, constituting 28% and 24% of all neural-recorded trials following an unsuccessful trial, respectively, and 4% and 5% of all neural-recorded trials following same-choice trials. c Top—The learning curve, i.e., the NHPs’ probability of choosing successfully. ‘AC’ indicates the association change trial; trials prior/post to the AC trial are of negative/positive sign, respectively. Middle—The learning slope (i.e., the derivative of the learning curve). Inset—the learning slope across the AC trial. Bottom—Switch probability.
Fig. 2
Fig. 2. GPe and DLPFC encoding of exploration-exploitation behavior.
a dorsolateral prefrontal cortex (DLPFC) (top, 12,035 recorded trials of 325 neurons) and external segment of the globus pallidus (GPe) (bottom, 17,327 recorded trials of 233 neurons) mean ± SEM z-normalized firing rates (FRs) around the reward outcome of trial N and subsequent cue choice in trial N + 1. The shaded gray area indicates the window for calculating the mean FR, as shown in the bar graphs on the right. Left—FRs around the reward outcome in trial N for successful (blue, reward) and unsuccessful (red, no reward) trials, with a z-score baseline from the two seconds before reward claiming. Right—FRs around cue choice in trial N + 1, with a z-score baseline from the two seconds before trial initiation. p-values are from two-tailed t tests comparing FRs. b DLPFC (top, 12,035 recorded trials of 325 neurons) and GPe (bottom, 17,327 recorded trials of 233 neurons) mean ± SEM z-normalized FRs around cue choice in exploratory trials (green, cue switch) and non-exploratory trials (orange, same cue as previous trial). p-values are from two-tailed t tests comparing FRs. c Trial type definitions: (1) Directed exploration—following unsuccessful trials with a choice switch. (2) Perseveration—following unsuccessful trials without a choice switch. (3) Random exploration—following successful trials with a choice switch. (4) Exploitation—following successful trials without a choice switch. Colors match those in panels (a) and (b). d Comparison of DLPFC (top, 1373 recorded trials of 325 neurons) and GPe (bottom, 2963 recorded trials of 233 neurons) FRs around choice selection in directed exploration and perseveration. Bar graphs show the mean ± SEM FR during the two seconds preceding cue choice. p-values (Bonferroni corrected for multiple comparisons) are from two-tailed t tests. e Comparison of DLPFC (top, 10,662 recorded trials of 325 neurons) and GPe (bottom, 14,364 recorded trials of 233 neurons) FRs in random exploration and exploitation. Bar graphs show the mean ± SEM FR during the two seconds before choice selection. p-values (Bonferroni corrected for multiple comparisons) are from two-tailed t tests. f Left—Mean ± SEM DLPFC and GPe FR leading to cue choice in the four trial types. Right—FR ratio relative to exploitation trials. p-values (Bonferroni corrected for multiple comparisons) are from two-tailed t-tests comparing FRs between random exploration, perseveration, directed exploration, and exploitation trials. Each bar chart is overlaid with 100 randomly selected data points falling within one standard deviation of the mean. For the full distribution of data points, please see Supplementary Fig. 3.
Fig. 3
Fig. 3. The dynamics of GPe activity correlate with exploratory behavior, while DLPFC activity lags and correlates with task knowledge.
a mean ±SEM dorsolateral prefrontal cortex (DLPFC, top) and external segment of the globus pallidus (GPe, bottom) firing rate (FRs) of the two seconds ensuing reward outcome (purple and brown, respectively) with the probability of reward omission (black). Correlation values between switch probability and neural activity and their corresponding p-values are represented by ‘r’ and ‘p,’ respectively. b Mean ±SEM DLPFC (top) and GPe (bottom) FRs of the two seconds preceding choice selection with the non-human primates’ (NHPs’) probability of switching to a new key (left), the probability of switching to the new rewarded key (making a successful switch, finding the new association, right top figure), and the probability of switching to an unrewarded key (unsuccessful switch, right bottom figure). c Mean ±SEM DLPFC (top) and GPe (bottom) firing rate of the two seconds preceding choice selection with the NHPs’ learning slope (black line). d Correlation between mean DLPFC and GPe firing rates (recorded during the two seconds leading to choice selection) during the first ten trials. Left—Comparing DLPFC activity in trial N with GPe activity in trial N + 1. Middle—Comparing DLPFC and GPe concurrent activities. Right—Comparing DLPFC activity in trial N + 1 with GPe activity in trial N. e Correlation values between DLPFC and GPe activities calculated from −4 (DLPFC activity precedes GPe activity by four trials) to +4 (GPe activity precedes DLPFC activity by four trials) trials lag. Bar colors correspond with the correlation color text of subplot (d). All correlation calculations were made using Pearson’s correlation and p-values, Bonferroni corrected for multiple comparisons.
Fig. 4
Fig. 4. LFP theta activity around cue choice alters under PCP administration.
a Analysis of local field potential (LFP) theta activity around cue choice in the naive state. Top—Mean theta-band (4–7 Hz) filtered LFP activity of the external segment of the globus pallidus (GPe, brown) and dorsolateral prefrontal cortex (DLPFC, purple), along with their corresponding envelopes. Middle—Mean ±SEM of the cross-correlation between the theta-band filtered envelopes of the DLPFC and GPe, computed across all individual envelope pairs. Bottom—Mean ±SEM of the Granger causality analysis of theta-band activity around cue choice (two seconds before until two seconds after) across the two brain regions. b The same as subplot a for the phencyclidine (PCP) period. c The same as subplot a for the post-PCP period.
Fig. 5
Fig. 5. PCP robustly affects behavior, DLPFC, and GPe activity.
a Left—non-human primates’ (NHPs) mean ± SEM learning curves in the naïve (black), phencyclidine (PCP, red), and post-PCP (blue) conditions. The inset shows associated learning slopes. Right—Average switch probability throughout the task, with the inset showing the probability of choosing the correct stimulus in the first six trials following a switch (a dashed gray line marks the chance level). b Learning criterion: average and SEM with 100 randomly selected data points overlaid. of the trial number when learning was achieved, defined as three consecutive successful trials. p-values represent the significance (Bonferroni corrected) of the two-tailed t test comparing learning criterion under PCP effect and post-PCP with the naïve state. c Left—Directed exploration probability, mean ±SEM (switch probability after an unsuccessful trial, with a total of 3202 trials in the naïve state, 5040 under the PCP effect, and 355 after PCP withdrawal). Right—Random exploration probability (switch probability after a successful trial, total of 18,869 trials in the naïve state, 13,159 under PCP effect, and 2715 after PCP withdrawal). Insets show data on a 0-1 Y-axis. p-values represent the significance (Bonferroni corrected) of the two-tailed t-test comparing directed and random exploration probabilities in PCP and post-PCP conditions to the naïve state. d Left—Pearson’s correlation of the dorsolateral prefrontal cortex (DLPFC, top) and external segment of the globus pallidus (GPe, bottom) activity with the probability of reward omission. Right—Correlation of DLPFC activity with learning slope (top) and GPe activity with switch probability (bottom). A total of 14,332 trials in the GPe and 10,708 trials in the DLPFC were recorded in the naïve state; 8291 trials in the GPe and 5034 trials in the DLPFC were recorded under the PCP effect; and 1788 trials in the GPe and 1858 trials in the DLPFC were recorded after PCP withdrawal. e DLPFC (top) and GPe (bottom) mean ± SEM FR around choice selection (time zero). f Left: Mean ± SEM activity in DLPFC (top) and GPe (bottom) during the 2 s preceding choice selection (shaded gray in e) following unsuccessful trials, across naïve (black), PCP (red), and post-PCP (blue) conditions. Right: Same, for successful trials. p-values from Bonferroni-corrected two-sample t tests compare each condition to naïve. Trial counts for unsuccessful trials: naïve—1373 DLPFC/2,963 GPe (325/233 neurons); PCP—1749 DLPFC/3291 GPe (178/149 neurons); post-PCP—163 DLPFC/192 GPe (45/33 neurons). For successful trials: naïve—10,662 DLPFC/14,364 GPe; PCP—4804 DLPFC/8355 GPe; post-PCP—1464 DLPFC/1251 GPe. Each bar chart is overlaid with 100 randomly selected data points falling within one standard deviation of the mean. For the full distribution of data points, please see Supplementary Fig. 3.
Fig. 6
Fig. 6. Adaptive reinforcement learning models replicate neuro-behavioral results and predict potential benefits for GPe stimulation under PCP administration.
a, b Adaptive forgetful model. a Top—Comparing the non-human primates’ (NHPs) normalized recorded activity of the external segment of the globus pallidus (GPe) firing rate (FR, solid line) with the normalized surprise measure αt (dashed line) calculated based on the NHPs’ choices. r and p indicate the correlation coefficient and p-values using Pearson’s correlation. Middle—Comparing the models’ and the NHPs’ learning curves. Bottom - Comparing αt value with the models’ switch probability. b Simulating the phencyclidine (PCP) state by increasing the model’s forgetfulness (ϕ). Simulated parameters color graded from black to red (ϕ=0.11). Top, learning criterion. Middle—αt value after an unsuccessful trial compared with the probability for directed exploration. Bottom—αt value after a successful trial compared with the probability for random exploration. c The same as (b), this time increasing the value of C, the αt modulating parameter. df The same as (ac), here showing the results of the adaptive combined (WM + RL) model. WM working memory, RL reinforcement learning.
Fig. 7
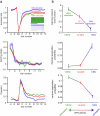
Fig. 7. GPe low-frequency macro stimulation improves task performance under PCP administration, whereas high-frequency stimulation hampers it.
Behavioral performance analysis was carried out under phencyclidine (PCP) administration. Red - No stimulation, blue—130 Hz continuous stimulation (activity dampener), and green—13 Hz continuous stimulation (activity enhancer). aTop—Mean ± SEM learning curve. Inset shows a one-second recording during 130 Hz stimulation (green) and during 13 Hz stimulation (blue), the gray bar shows 500 ms duration and a recording of one stimulation epoch (yellow). Middle—learning slope. Bottom—Switch probability. b Top—Mean ± SEM learning criterion (achieving three consecutive correct choices) during 130 Hz stimulation (left, blue, total of 343 blocks), no stimulation (middle, red, total of 770 blocks), and 13 Hz stimulation (right, green, total of 236 blocks). Middlethe non-human primates’ (NHPs) Mean ± SEM probability of making directed exploration (i.e., to switch their choice after a prediction-outcome mismatch). A total of 1762 trials during 130 Hz stimulation, 3,611 trials without stimulation and 771 trials with 13 Hz stimulation. Bottom—The NHPs’ Mean ± SEM likelihood of making random exploration (i.e., to switch their choice after congruent prediction-outcome). A total of 3345 trials under 130 Hz stimulation, 7939 trials without stimulation and 2681 with 13 Hz stimulation.

References

    1. Wilson, R. C., Geana, A., White, J. M., Ludvig, E. A. & Cohen, J. D. Humans use directed and random exploration to solve the exploration-exploitation dilemma. J. Exp. Psychol. Gen.143, 2074–2081 (2014). - PMC - PubMed
    1. Bouchacourt, F., Tafazoli, S., Mattar, M. G., Buschman, T. J. & Daw, N. D. Interplay between rule learning and rule switching in a perceptual categorization task. bioRxiv10.1101/2022.01.29.478330 (2022). - PMC - PubMed
    1. Wilson, R. C., Bonawitz, E., Costa, V. D. & Ebitz, R. B. Balancing exploration and exploitation with information and randomization. Curr. Opin. Behav. Sci.38, 49–56 (2021). - PMC - PubMed
    1. Gershman, S. J. Deconstructing the human algorithms for exploration. Cognition173, 34–42 (2018). - PMC - PubMed
    1. Sadeghiyeh, H. et al. Temporal discounting correlates with directed exploration but not with random exploration. Sci. Rep. 10, 4020 (2020). - PMC - PubMed

MeSH terms

Substances

LinkOut - more resources