. 2025 Jul;28(7):1446-1459.
doi: 10.1038/s41593-025-01972-9. Epub 2025 May 28.

Choroid plexus apocrine secretion shapes CSF proteome during mouse brain development

Affiliations

Choroid plexus apocrine secretion shapes CSF proteome during mouse brain development

Ya'el Courtney et al. Nat Neurosci. 2025 Jul.

Abstract

The choroid plexus (ChP) regulates cerebrospinal fluid (CSF) composition, providing essential molecular cues for brain development; yet, embryonic ChP secretory mechanisms remain poorly defined. Here we identify apocrine secretion by embryonic ChP epithelial cells as a key regulator of the CSF proteome and neurodevelopment in male and female mice. We demonstrate that the activation of serotonergic 5-HT2C receptors (by WAY-161503) triggers sustained Ca2+ signaling, driving high-volume apocrine secretion in mouse and human ChP. This secretion alters the CSF proteome, stimulating neural progenitors lining the brain's ventricles and shifting their developmental trajectory. Inducing ChP secretion in utero in mice disrupts neural progenitor dynamics, cerebral cortical architecture and offspring behavior. Additionally, illness or lysergic acid diethylamide exposure during pregnancy provokes coordinated ChP secretion in the mouse embryo. Our findings reveal a fundamental secretory pathway in the ChP that shapes brain development, highlighting how its disruption can have lasting consequences for brain health.


Conflict of interest statement

Competing Interests: The authors declare that they have no competing interests.

Figures
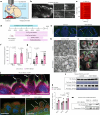
Fig. 1
Fig. 1. Maternal–fetal activation of ChP 5-HT2C evokes apocrine secretion of proteins into the CSF.
a, Placenta-attached ex vivo imaging setup. b, Overview image of exposed E16.5 4V ChP and time points showing tissue Ca2+ response to WAY-161503. c, Heat map of E16.5 ChP cellular Ca2+ responses to direct WAY-161503 (WAY) exposure. d, Timeline of readouts of apocrine secretion. e, Representative confocal images of E12.5 mouse brain 30 min after maternal saline (control) or WAY-161503 delivery; scale bars 100 µm. f, RT–qPCR analysis of ChP Fos expression at E14.5 (left; N = 11 embryos, three litters) and E16.5 (right; N = 10 embryos, three litters). F, fluorescence. g, Quantification of the data in h; N = 20 embryos, four litters per condition. h, SEM of E14.5 (top) and E16.5 (bottom) LV ChP; scale bars, 20 µm. i, Representative confocal images of E16.5 LV ChP 30 min after maternal WAY-161503 delivery; scale bars, 20 µm; Ac-Tubulin, acetylated tubulin. j, Top: protein-retention expansion microscopy of E16.5 LV ChP 30 min after maternal WAY-161503 delivery. Bottom: fetal GW21 LV control ChP (left) or after a 30-min incubation with WAY-161503 (right). White arrows indicate TTR-containing aposomes. Scale bars, 10 µm. k, E12.5, E14.5 and E16.5 CSF protein concentration (conc.) 30 min after maternal saline (E12.5 N = 4, E14.5 N = 7, E16.5 N = 8) or WAY-161503 (E12.5 N = 3, E14.5 N = 6, E16.5 n = 7) delivery. Each point represents pooled CSF from one litter. l, Western blot for TTR and SOD3 in E16.5 mouse CSF. A cropped Ponceau stain of each membrane is displayed as a loading control. m, Western blot for TTR from human ChP-conditioned artificial CSF (aCSF) following exposure to WAY-161503 or vehicle control. A cropped Coomassie blue stain is displayed as a loading control. Full blots and stains are shown in Supplementary Fig. 2. All data are presented as mean ± s.e.m. P values were calculated by two-way analysis of variance (ANOVA) with a Sidak correction for f, g and k. Images in b represent experiments repeated three times with similar results, in i represent experiments repeated ten times with similar results and in l represent experiments repeated five times with similar results. The experiment in m was only performed once. Panel d created with BioRender.com. Source data
Fig. 2
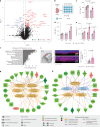
Fig. 2. Apocrine secretion alters the embryonic CSF proteome.
a, Volcano plot showing differences in protein abundance between E16.5 CSF at baseline and following apocrine secretion. Proteins with P values less than 0.05 appear above the horizontal dashed line. The vertical dashed lines indicate the threshold of ±1.1 fold change (FC); N = 3 pooled litters per condition. b, Experimental schematic for data presented in c and d. c, Enzyme-linked immunosorbent assay (ELISA) of explant-conditioned aCSF for IGF-2. Each point represents aCSF conditioned by five E16.5 ChP explants; LV N = 14, 3V N = 7, 4V N = 7. d, ELISA of explant-conditioned aCSF for SHH. Each point represents aCSF conditioned by five E16.5 ChP explants; LV N = 6, 3V N= 5, 4V N = 6. e, ELISA of explant-conditioned aCSF for insulin. Each point represents aCSF conditioned by five E16.5 ChP explants; LV N = 5, 3V N = 5, 4V N = 5. f, Biological pathways identified by GSEA for proteins released in vivo by ChP 5-HT2C-evoked secretion. A one-sided, right-tailed Fisher’s exact test was used to assess over-representation of pathways (P < 0.05), as our analysis focused specifically on identifying enrichment in the observed direction of change; ns, not significant (P > 0.05); *P ≤ 0.05; **P ≤ 0.01; ***P ≤ 0.001; ****P ≤ 0.0001. g,h, IPA of ChP in vivo secreted proteins demonstrated activation of proliferation- and development-related pathways (g) and activation of neuronal survival, neurite outgrowth and synapse development pathways and inhibition of neuronal apoptosis (h). i, Left: Nissl annotation from the Allen Developing Mouse Brain Reference Atlas (developingmouse.brain-map.org). Confocal images of phosphorylated AKT (pAKT) in E14.5 neural progenitor cells (center) and quantification of pAKT fluorescence intensity (right) are also shown (control N = 11, three litters; WAY-161503 N = 8, three litters); scale bars, 20 µm. All data are presented as mean ± s.e.m. P values were calculated by one-way ANOVA with a Tukey correction for ce, a one-sided Fisher’s exact test for f and a two-tailed t-test for i. Panel b created with BioRender.com. Source data
Fig. 3
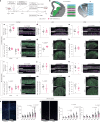
Fig. 3. Embryonic overstimulation of ChP secretion is accompanied by abnormal cerebral cortical development.
a, Schematic depicting experiment and readouts. b, S1 cortical cell density is unchanged in E12.5–E16.5 (N = 10 mice, four litters) or E12.5 (N = 8 mice, three litters) WAY-161503 exposure experimental groups versus vehicle control (N = 15 mice, four litters). c, Quantification of CTIP2+, TBR1+ and SATB2+ neuronal populations in P8 S1 in vehicle control (N = 15 mice, four litters), E12.5 WAY-161503 (N = 8 mice, three litters) and E12.5–E16.5 (N = 10 mice, four litters) experimental groups. d, Top: confocal images of SATB2 (green) in the S1. Bottom: SATB2+ neuron proportion by bin (vehicle control N = 14 mice, four litters; E12.5–E16.5 WAY-161503 N = 10 mice, three litters; E12.5 WAY-161503 N= 6 mice, three litters). e, Top: confocal images of TBR1 (green) in the S1. Bottom: TBR1+ neuron proportion by bin (vehicle control N = 7 mice, three litters; E12.5–E16.5 WAY-161503 N = 10 mice, three litters; E12.5 WAY-161503 N = 5 mice, three litters). f, Top: confocal images of CTIP2 (green) in the S1. Bottom: CTIP2+ neuron proportion by bin (vehicle control N= 7 mice, three litters; E12.5–E16.5 WAY-161503 N = 10 mice, three litters; E12.5 WAY-161503 N = 8 mice, three litters). g, Top: representative confocal images of PV and SST interneurons in the S1. Bottom: percentage of nuclei in the S1 or primary motor cortex (M1) labeled by PV or SST (vehicle control N = 9 mice, three litters; E12.5–E16.5 WAY-161503 N = 7 mice, three litters; E12.5 WAY-161503 N = 8 mice, three litters); scale bars, 100 μm. h, Confocal images (left) and quantification (right) of the percentage of GFAP+ coverage in the S1, hippocampus (HC) and corpus callosum (CC; vehicle control N = 9 mice, three litters; E12.5–E16.5 WAY-161503 N = 13 mice, four litters); scale bars, 50 μm. i, Confocal images (left) and quantification (right) of IBA1+ microglia in the S1, hippocampus and corpus callosum (vehicle control N = 9 mice, three litters; E12.5–E16.5 WAY-161503 N = 13 mice, four litters); scale bars, 50 μm. All data are presented as mean ± s.e.m. Regions of interest depicted in df are 1,000 µm tall by 400 µm wide. P values were calculated by two-way ANOVA with a Sidak correction for bg and by one-way ANOVA with a Tukey correction for h and i. Data points in dg represent the mean of three technical replicate stainings performed on three serial sections per biological replicate mouse. Data points in h and i represent the mean of three fields of view per biological replicate mouse. Panel a created with BioRender.com. Source data
Fig. 4
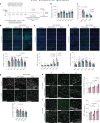
Fig. 4. Effects of ChP overstimulation on cortical and ganglionic eminence progenitor proliferation and differentiation.
a, Schematic of experimental design. b, Diagram illustrating the analyzed regions of interest: cortex, LGE and MGE. ce, Quantification and representative images of PHH3+DAPI+ mitotic nuclei per 10,000 µm² in the cortex (c; control N = 13; WAY-161503 N = 13), LGE (d; control N = 10; WAY-161503 N = 14) and MGE (e; control N = 10; WAY-161503 N = 13) at 2 h post-EdU. f, Quantification and representative images of EdU+ nuclei in cortical CP/IZ and VZ regions at 2 h post-EdU (control N = 13; WAY-161503 N = 15). g,h, Quantification and representative images of EdU+ nuclei per 10,000 µm² in the LGE (g; control N = 9; WAY-161503 N = 12) and MGE (h; control N = 9; WAY-161503 N = 12) at 2 h post-EdU. ik, Quantification and representative images of PHH3+DAPI+ mitotic nuclei per 10,000 µm² in the cortex (i; control N = 10, WAY-161503 N = 11), LGE (j; control N = 9, WAY-161503 N = 12) and MGE (k; control N = 10, WAY-161503 N = 9) at 18 h post-EdU. l, Quantification and representative images of EdU+ nuclei in cortical CP/IZ and VZ regions at 18 h post-EdU (control N = 10, WAY-161503 N = 12). m,n, Quantification and representative images of EdU+ nuclei per 10,000 µm² in the LGE (m; control N = 10, WAY-161503 N = 11) and MGE (n; control N = 10, WAY-161503 N = 10) at 18 h post-EdU. o, Quantification and representative images of overall EdU+ cell density at P8 in the cortex (control N = 9, WAY-161503 N = 8). p, Bar graphs depicting the percentage of TBR1+EdU+ cells (center) and TBR1+EdU cells (right) and representative images (left) of the S1 at P8 (control N = 8, WAY-161503 N = 8). All data are presented as mean ± s.e.m. P values were calculated by two-sided t-tests for ce, gk, m and n, two-way ANOVA with a Sidak correction for f and l and one-way ANOVA with a Tukey correction for p; scale bars, 50 μm (ce and ik), 100 μm (fh and ln) and 200 μm (o and p). All N indicate the number of mice collected from three separate litters. Panel a created with BioRender.com. Source data
Fig. 5
Fig. 5. Embryonic overstimulation of ChP secretion is associated with abnormal adult behavior.
a,b, Three-chambered social approach task. The time in the chamber with a novel mouse or novel object or in the center (a) and distance traveled (b) was assessed (control N = 9, WAY-161503 N = 10). c, Graph of marbles buried (control N = 9, WAY-161503 N = 10). d, Sex differences in marbles buried by control or repeated apocrine mice (N = 4–5; male (M) control N = 4, WAY-161503 N = 5; female (F) control N = 5, WAY-161503 N = 5). e, Relative LV ChP Htr2c expression determined by RT–qPCR in E16.5 mice with XY or XX chromosome complement (N = 7 XX and 10 XY). f,g, Male–female USVs. Total vocalizations (f) and cumulative time that a male mouse spent in physical contact with a female mouse (g) were determined (control N = 9, WAY-161503 N = 10). h, Many subtypes of adult male–female USVs increase after embryonic overstimulation of apocrine secretion (control N = 9, WAY-161503 N = 10). All data are presented as mean ± s.e.m. P values were calculated by one-way ANOVA with a Tukey correction for a and b, two-tailed t-test for c and f, two-way ANOVA with a Sidak correction for d and h and Mann–Whitney test for e and g. All N represent the numbers of mice collected from three separate litters. Source data
Fig. 6
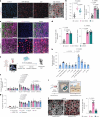
Fig. 6. An approach for screening maternal–fetal apocrine triggers.
a, Confocal images of the E16.5 LV ChP; scale bars, 20 µm. b, Left: RT–qPCR of Fos in the E16.5 ChP (saline N = 13, five litters; WAY-161503 N = 19, five litters; LSD N = 18, five litters). Right: proportion of cells with aposomes in the E16.5 LV ChP after maternal LSD exposure. c, Confocal images of the E16.5 LV ChP; scale bars, 20 µm. d, Proportion of cells with Fos (right) or aposomes (left) in the E16.5 LV ChP following maternal saline (N = 7, three litters), WAY-161503 (N = 7, three litters) or CIM0216 (N = 6, three litters) injection. e, Experiment for results in f and g. f,g, Aposomes (f) and Fos expression (g) in the E16.5 LV ChP after incubation with blockers and agonists; N = 10 explants per condition. h, Proportion of cells with aposomes after LV ChP incubation with various treatments (0 mM Ca2+ N = 6, 0 mM Ca2+ + WAY-161503 N = 10, 0 mM Ca2+ + thapsigargin N = 6, 1.4 mM Ca2+ N = 6, 2.1 mM Ca2+ N = 6, 2.8 mM Ca2+ N = 6, 2.8 mM Ca2+ + WAY-161503 N = 9, 2.8 mM Ca2+ + thapsigargin N = 11, 3.5 mM Ca2+ N = 6, 4.2 mM Ca2+ N = 5). i, Experimental schematic for results in j. j, Representative confocal images and quantification of aposomes (circled in red) in the E14.5 LV ChP after maternal saline (N = 9) or poly(I:C) injection (24 h N = 14, 48 h N = 9); scale bar 20 µm. All data are presented as mean ± s.e.m. P values were calculated by Kruskal–Wallis test for a, d and j or two-way ANOVA with a Sidak correction for fh. Panels e and i created with BioRender.com. Source data
Fig. 7
Fig. 7. Embryonic ChP apocrine secretion mechanism and effects of overstimulation.
a, Schematic depicting the intracellular mechanisms of apocrine secretion downstream of 5-HT2C or TRPM3. b, Schematic depicting a healthy level of embryonic apocrine secretion versus an unhealthy supraphysiological level and their effects on cerebral cortical development. Figure created with BioRender.com.
Extended Data Fig. 1
Extended Data Fig. 1. Maternal anesthesia method impacts maternal-fetal transmission of WAY-161503 and ChP activation.
(A) Isofluorane inhibits E16.5 Fos induction. No anesthesia control n = 7, WAY n = 6. 2-4% vaporized isofluorane control n = 7, WAY n = 7. Ketamine/xylazine control n = 4, WAY n = 4. Isofluorane to ketamine/xylazine transition control n = 5, WAY n = 5. (B) qPCR validation of Htr2c knockout mouse lines. N = 7 wild-type and 5 KO embryos. (C) WAY-161503 does not induce activity-dependent gene expression in ChP from Htr2c knockout mouse line, n = 3 embryos/condition. (D) Representative images of RNAscope validation of Htr2c knockout in LV ChP. Scale bars 200 µm. (E) Urethane maintains WAY-161503-induced Fos. IP ketamine/xylazine, no surgery control n = 3, WAY n = 3. IP urethane/ketamine, abdominal incision, internal uterine horn control n = 3, WAY n = 4. IP urethane/ketamine, full mock setup control n = 3, WAY n = 2. Data Presentation: All data presented as mean ± SEM. P values from two-way ANOVA with Sidak correction for (A), (C), and (E) and from two-tailed unpaired t-test for (B). Source data
Extended Data Fig. 2
Extended Data Fig. 2. In the embryonic mouse brain, Htr2c is selectively expressed in ChP.
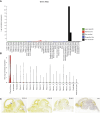
(A) Bar graph of E14.5 and P0 Htr2c expression reveals that, throughout the mouse neocortex, ChP expresses Htr2c during embryonic development. Notably, Htr2c is not expressed in progenitors. Created with the Zylka Lab’s Single-cell transcriptomic analysis of mouse neocortical development gene-by-gene search webpage with data from Loo et al.. https://zylkalab.org/datamousecortex (B) Violin plot of E14 Htr2c expression demonstrates high ChP Htr2c expression in mouse brain at E14.5. created with Broad Institute Single Cell Portal from Mouse E14 brain single nucleus RNA sequencing data gathered for Russell et al.. https://singlecell.broadinstitute.org/single_cell/study/SCP2170/slide-tags-snrna-seq-on-mouse-embryonic-e14-brain (C) Expression of Htr2c in E13.5, E15.5, E18.5, and P4 mouse brain shows that before E18.5, Htr2c is highly and predominantly expressed in ChP. At E18.5, low expression arises in brainstem nuclei. At P4, Htr2c expression is widespread. Allen Developing Mouse Brain Atlas, developingmouse.brain-map.org/experiment/show/100047619.
Extended Data Fig. 3
Extended Data Fig. 3. Choroid plexus aposomes.
(A) Intensity of FOS immunofluorescence in E12.5 ChP, N = 8 embryos from 4 litters/condition. (B) Apocrine structures visualized by, from left to right, SEM, H&E stain, and IHC. (C) TEM image depicting an E16.5 ChP epithelial cell with an aposome protruding immediately adjacent to cilia. (D) SEM image depicting an E16.5 ChP epithelial cell with a collapsed, likely post-secretion aposome protruding immediately adjacent to cilia. (E) SEM image depicting an E16.5 epithelial cell with an emerging aposome protruding immediately adjacent to cilia. (F) Representative confocal images of control (top) and apocrine (bottom) LV ChP showing the apical depressions, unstained by Ezrin, from which aposomes arise. (G) Expansion microscopy image depicting two E16.5 ChP epithelial cells, each with aposomes supported by a network of microtubules. (H) Quantification of size of aposomes at E16.5, N = 30 mice from 6 litters. (I) SEM of adult LV ChP after control (saline) or WAY-161503 injection. Aposomes quantified in (J). (K) Two representative silver stains of E16.5 CSF 30 min following maternal saline (control, left) or WAY-161503 (right). Red arrows indicate proteins whose concentration appeared visually to differ between conditions. (L) Expansion microscopy image depicting ChP LV epithelial cells, one with an aposome containing mitochondria (Citrate Synthase antibody). (M) Quantification of LV ChP aposomes at baseline, 30 min after WAY-161503 injection, 24 h after WAY-161503 injection, or after 2 injections of WAY-161503 at a 24 h interval. Data Presentation: All data presented as mean ± SEM. Scale bars 5 µm unless otherwise noted. P values from two-tailed t-test for (A) and (J), and from one-way ANOVA with Tukey correction for (M). Source data
Extended Data Fig. 4
Extended Data Fig. 4. Choroid plexus apocrine secretion is not apoptotic.
Representative confocal images of LV ChP explants, CC3 staining reveals apoptosis in an in vitro staurosporine-treated positive control for cell death (A), but not following an in vivo control injection (B) or at various time points after evoking in vivo apocrine secretion (B)-(G). Cropped views on the left, scale bars 20 µm. Whole mount LV ChP views on the right, scale bars 500 µm.
Extended Data Fig. 5
Extended Data Fig. 5. Blood-derived proteins in embryonic CSF following ChP 5HT2C activation.
(A) Fluorescence intensity readings for hemoglobin and (B) hemopexin levels in E16.5 CSF after maternal saline or WAY-161503 injection, in SomaScan buffer solution, and in SomaScan human plasma calibrator. (C) Fluorescence intensity of top 25 common blood-derived proteins in CSF reveals no increases in WAY-161503-treated CSF compared to controls (saline-treated). (D) Heatmap summarizing fluorescence intensity of blood-derived proteins detected in CSF across conditions. Data Presentation: All data presented as mean ± SEM. P values from one-way ANOVA with Tukey correction for (A) and (B), and from two-way ANOVA with Sidak correction for (C) and (D). Source data
Extended Data Fig. 6
Extended Data Fig. 6. ChP apocrine proteomics.
(A) SomaScan intensity measurements for IGF-2 and SHH protein in CSF demonstrate ChP release. N = 3 E16.5 CSF samples, each pooled from 3 litters. (B) IGF-2 levels in conditioned aCSF measured by ELISA for each of three human fetal ChP samples. Half of each sample was incubated with vehicle control in aCSF, half with WAY-161503. N = 3. (C) Western blot for Cofilin-2 and phospho-Cofilin-2 in CSF from E16.5 embryos 30 min after maternal WAY-161503 delivery. Cropped Ponceau stain of each membrane displayed as loading control, full blots and Ponceau stains in Supplementary Fig. 2. Each sample represents one pooled litter. N = 3 samples per condition. Data Presentation: All data presented as mean ± SEM. P values from two-way ANOVA with Sidak correction for (A). Source data
Extended Data Fig. 7
Extended Data Fig. 7. Effects of embryonic stimulation of ChP secretion on mouse brain and oligodendrocytes.
(A) P8 brain weight, (B) body weight, and (C) brain:body ratio in control (n = 27), repeated WAY-161503 (n = 27), and acute WAY-161503 (N = 14) mice. (D) Schematic, (E) representative confocal images, and (F) quantification of oligodendrocyte and oligodendrocyte precursor markers SOX2 (Region 1 control N = 13, WAY N = 6; Region 2 control N = 14, WAY N = 10; Region 3 control N = 9, WAY N = 4), OLIG2 (Region 1 control N = 11, WAY N = 4; Region 2 control N = 9, WAY N = 8; Region 3 control N = 5, WAY N = 5), and CC1 (Region 1 control N = 13, WAY N = 5; Region 2 control N = 9, WAY N = 8; Region 3 control N = 6, WAY N = 6), in the corpus callosum. Data Presentation: All data presented as mean ± SEM. P values from one-way ANOVA with Tukey correction for (A), (B), and (C), and from two-way ANOVA with Sidak correction for (F). Source data
Extended Data Fig. 8
Extended Data Fig. 8. HTR2C receptor is not necessary for baseline rates of ChP apocrine secretion.
(A) Representative SEM of E16.5 Htr2c KO mouse LV ChP 30 min after maternal injection of a vehicle control (left), WAY-161503 (middle), and a C57BL6/J WT mouse after WAY-161503 (right). scale bars 30 µm. (B) Quantification of aposomes. N = 20 mice from 4 litters. (C) Representative confocal images and quantification of epiplexus immune cells after maternal saline (N = 6) or PolyI:C delivery (24H N = 9, 48H N = 5). Scale bar 100 µm. P values from one-way ANOVA. Data Presentation: All data presented as mean ± SEM. P values from Kruskal-Wallis test for (B) and from one-way ANOVA with Tukey correction for (C). Source data

Update of

References

    1. Silva-Vargas, V., Maldonado-Soto, A. R., Mizrak, D., Codega, P. & Doetsch, F. Age-dependent niche signals from the choroid plexus regulate adult neural stem cells. Cell Stem Cell19, 643–652 (2016). - PubMed
    1. Saunders, N. R., Dziegielewska, K. M., Fame, R. M., Lehtinen, M. K. & Liddelow, S. A. The choroid plexus: a missing link in our understanding of brain development and function. Physiol. Rev.103, 919–956 (2023). - PMC - PubMed
    1. Damkier, H. H., Brown, P. D. & Praetorius, J. Cerebrospinal fluid secretion by the choroid plexus. Physiol. Rev.93, 1847–1892 (2013). - PubMed
    1. Lun, M. P. et al. Spatially heterogeneous choroid plexus transcriptomes encode positional identity and contribute to regional CSF production. J. Neurosci.35, 4903–4916 (2015). - PMC - PubMed
    1. Lehtinen, M. K. et al. The cerebrospinal fluid provides a proliferative niche for neural progenitor cells. Neuron69, 893–905 (2011). - PMC - PubMed

LinkOut - more resources