. 2025 Jul;643(8073):1097-1106.
doi: 10.1038/s41586-025-09070-3. Epub 2025 May 28.

In vivo haemopoietic stem cell gene therapy enabled by postnatal trafficking

Affiliations

In vivo haemopoietic stem cell gene therapy enabled by postnatal trafficking

Michela Milani et al. Nature. 2025 Jul.

Abstract

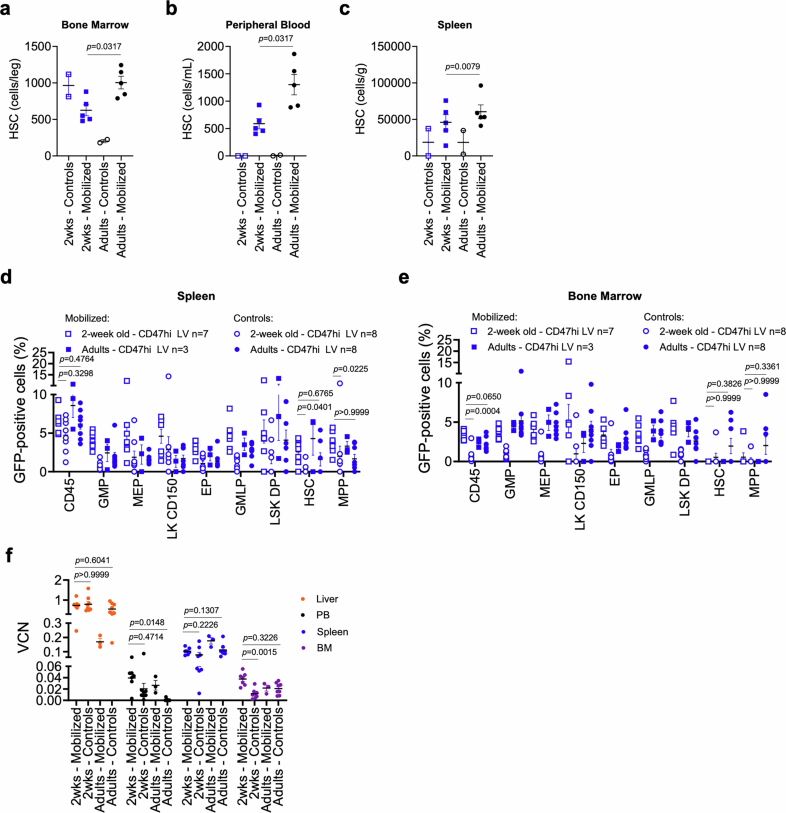
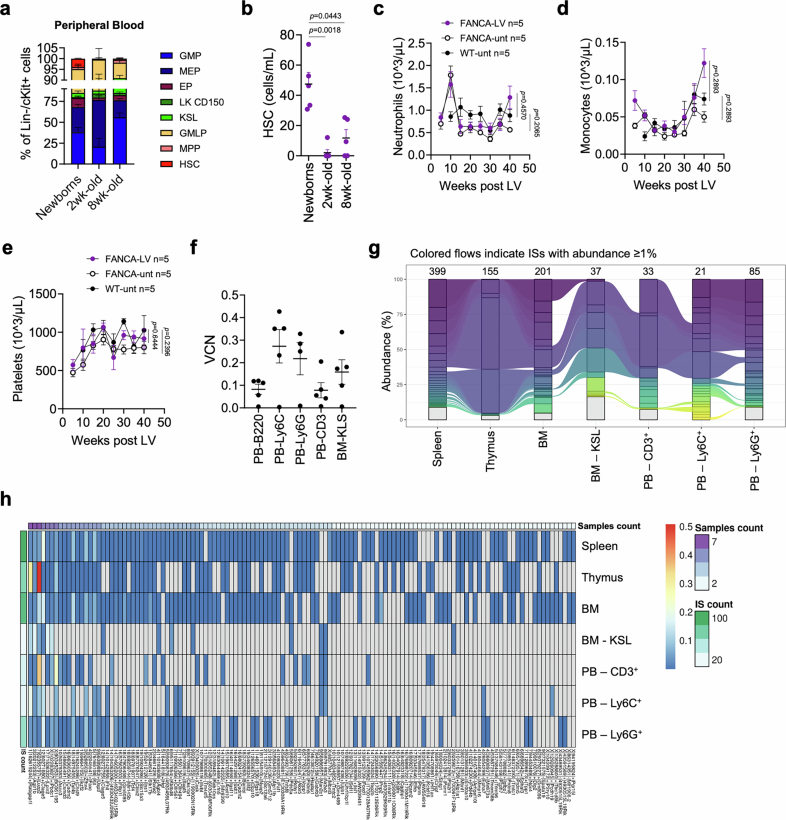
Lentiviral vector (LV)-mediated ex vivo gene therapy for haematopoietic stem and progenitor cells (HSPCs) has delivered on the promise of a 'one-and-done' treatment for several genetic diseases1. However, ex vivo manipulation and patient conditioning before transplantation are major hurdles that could be overcome by an in vivo approach. Here we demonstrate that in vivo gene delivery to HSPCs after systemic LV administration is enabled by the substantial trafficking of these cells from the liver to the bone marrow in newborn mice. We improved gene-transfer efficiency using a phagocytosis-shielded LV, successfully reaching bona fide HSPCs capable of long-term multilineage output and engraftment after serial transplantation, as confirmed by clonal tracking. HSPC mobilization further increased gene transfer, extending the window of intervention, although permissiveness to LV transduction declined with age. We successfully tested this in vivo strategy in mouse models of adenosine deaminase deficiency, autosomal recessive osteopetrosis and Fanconi anaemia. Interestingly, in vivo gene transfer provided a selective advantage to corrected HSPCs in Fanconi anaemia, leading to near-complete haematopoietic reconstitution and prevention of bone marrow failure. Given that circulating HSPCs in humans are also most abundant shortly after birth, in vivo HSPC gene transfer holds strong translational potential across multiple diseases.


Conflict of interest statement

Competing interests: P.R. and J.A.B. receive funding and have licensed the PGK.FANCA-LV to Rocket Pharmaceuticals and are inventors on patents filed by CIEMAT, CIBERER and Fundación Jiménez Díaz, and may be entitled to receive financial benefits from the licensing of such patents. J.A.B. is consultant of Rocket Pharmaceuticals, A.A. is the principal investigator of clinical trials with LV-transduced haematopoietic stem cells sponsored by Orchard Therapeutics or Fondazione Telethon. L.N. and A.C. are inventors on patent applications submitted by Fondazione Telethon or the San Raffaele Scientific Institute on LV technology for in vivo use related to the work presented in this paper. The other authors declare no competing interests.

Figures

Fig. 1
Fig. 1. Characterization of HSPCs over time and in vivo gene transfer by LVs.
a, Haematopoietic cells were collected from the BM, spleen, liver and PB of newborn and 1-, 2- and 8-week-old C57BL/6 mice and analysed by FACS. FSC, forward scatter; SSC, side scatter. bi, Mean and s.e.m. of the percentage of different populations between LinKIT+ HSPCs (be) or single values and mean and s.e.m of the absolute count of HSCs (fi) in the BM (b,f), PB (c,g), spleen (d,h) and liver (e,i) at the indicated ages. n = 5 mice per group. Newborn PB: 10 pools from 50 mice. Spleen: n = 10. Kruskal–Wallis test with Dunn’s multiple-comparisons test (compared with newborn). EP, erythroid progenitor cell (PC); GMLP, granulocyte–monocyte–lymphoid PC; GMP, granulocyte–monocyte PC; KSL, KIT+SCA-1+Lin cell; LK CD150, LinKIT+CD150+ cell; MEP, megakaryocyte–erythroid PC; MPP, multipotent PC. j, Experimental scheme: LV was administered i.v. to newborn C57BL/6 mice (510 transducing units, TU kg−1). GFP expression was monitored monthly in PB of treated mice. After 17 weeks, GFP+ cells were FACS-sorted from the BM and transplanted into busulfan-conditioned adult C57BL/6 mice. k,l, Mean and s.e.m. of GFP+ cells measured over time in the PB of treated mice (n = 19, k) and in the indicated populations 17 weeks after LV administration (l).  Prog, progenitor cells. mq, Single values of GFP+ cells measured over time in PB of individual surviving transplanted mice (mp) and in the indicated populations 20 weeks after transplant (q). DN, double negative cells; DP, double positive cells. r, Heat map showing integration sites (ISs) (columns) shared between LV-treated newborn mice (pooled, n = 19) 17 weeks after administration and transplanted mice (pooled, n = 4) 20 weeks after transplant (shown in k,l). TPX: indicated organs of transplanted mice shown in mq. Sample count indicates the number of samples (rows) sharing a given IS. A complete list of the ISs is provided in Supplementary Table 2. Schematics in a and j created with BioRender. Milani, M. (2025): a, https://BioRender.com/hvji2y3; j, https://BioRender.com/5z7zf6u. Source Data
Fig. 2
Fig. 2. In vivo HSPC gene transfer enhancement.
a,b, Single values and mean and s.e.m. of HSC absolute count in BM (a) and PB (b) of 2-week-old mobilized (n = 6) or control (n = 7) C57BL/6 mice. Mann–Whitney U-test. cf, Mean and s.e.m. (c,d) with single values (e,f) of GFP+ cells (c,e) and VCN (d,f) in PB (c,d), BM (e) and whole organs (f) of 2-week-old mobilized (n = 6) or control (n = 6) C57BL/6 mice over time (PB, 1.1 × 1011 TU kg−1) and 20 weeks after LV administration (e,f). DC, denditric cells; Gran, granulocytes; LSK DP, LinSCA-1+KIT+ double positive cells; Mono, monocytes; NK: natural killer cells. Mann–Whitney U-test. gj, Mean and s.e.m. (gi) with single values (j) of GFP+ cells (g,h,j) and VCN (i) in PB (gi) or BM (j) of mice transplanted with BM cells from control (g, n = 5) or mobilized (h, n = 6) mice over time (PB, 15 million CD45+ cells per recipient) and 16 weeks after transplant (j). Mann–Whitney U-test. k,l, Mean and s.e.m. of GFP+ cells (k) and VCN (l) in PB of mobilized (n = 7) or control (n = 6) newborn C57BL/6 mice (9 × 1010 TU kg−1). Mann–Whitney U-test. m,n, Mean and s.e.m. (m) with single values (n) of GFP+ cells in PB over time (m) and BM (n) 20 weeks after LV administration (5 × 1010 TU kg−1) in NSG mice (CD47high-LV newborns, n = 12; CD47free-LV newborns, n = 7; CD47high-LV adults, n = 6). Kruskal–Wallis test with Dunn’s multiple-comparisons test. o, Mean and s.e.m. of GFP+ cells in PB of mobilized (n = 8) and control (n = 7) 2-week-old and adult NSG mice mobilized (n = 4) or not (n = 8) (4.5 × 1010 TU kg−1). Kruskal–Wallis test with Dunn’s multiple-comparisons test (compared with 2-week-old controls). p, Single values and mean and s.e.m. of GFP+ cells in PB 16 weeks after LV administration in indicated mice. NSG, CD47high-LV 6 × 1010 TU kg−1. The same data reported in m and o. Kruskal–Wallis test with Dunn’s multiple-comparisons test. q,r, Mean and s.e.m. of GFP+ cells in PB of indicated mice treated at the indicated LV doses and ages (newborn, q; 2-week-old or adult mice, r). Source Data
Fig. 3
Fig. 3. In vivo HSPC gene transfer in ADA-SCID newborn mice.
a, Newborn ADA-SCID mice or WT littermates were treated with 2.5 × 1010 TU kg1 of the indicated LV. At 20 weeks after LV administration, 10–13 million total BM cells were transplanted into irradiated NSG mice. b, Survival of ADA-SCID mice treated as newborns with PGK.ADA-LV (n = 7), PGK.ADA.122mirT-LV (n = 14) or ET.ADA.142mirT-LV (n = 5), untreated (knockout (KO), n = 17) and LV-treated WT (WT, n = 30) littermates. WT littermates were treated in parallel with ADA-SCID mice; a pooled dataset of all LV-treated WT mice is reported, regardless of the administered LV construct. log-rank Mantel–Cox test with Bonferroni’s correction (compared with the PGK.ADA group). ce, Mean and s.e.m. of the VCN (c), T lymphocytes measured by FACS (d) and lymphocyte counts measured by haemocytometer (e) in the PB of ADA-SCID mice treated with the indicated LV as newborns. Sample sizes (n) at each time point are reported below the graphs. Linear mixed-effects (LME) model (compared with WT; Supplementary Tables 3–5). f,g, Mean and s.e.m. of the percentage of the indicated populations in the spleen (f) and thymus (g) of ADA-SCID mice treated as newborns with the indicated LV or left untreated, 20 weeks after LV administration. Sample sizes (n) are reported above the bars. h, Survival of NSG mice transplanted with total BM cells isolated from ADA-SCID mice shown in bg. log-rank Mantel–Cox test with Bonferroni’s correction (compared with WT). im, Mean and s.e.m. of lymphocyte counts in PB (8 weeks (i) or 12 weeks (j) after transplant), percentage of the indicated populations in the spleen (k) and thymus (l) or single values and mean and s.e.m. of VCN measured in the indicated organs (m) 12 weeks after transplant. Kruskal–Wallis test followed by post hoc analysis. Sample sizes (n) are reported above the bars (k,l) or in the graphs. Schematics in a created with BioRender. Milani, M. (2025) https://BioRender.com/7wda8gx. Source Data
Fig. 4
Fig. 4. In vivo HSPC gene transfer in Fanca/ newborn mice.
a,b, Single VCN values (a) and VCN fold expansion (b; over 5 weeks) in PB of Fanca/ mice treated as newborns (1.5 × 1010 TU kg1, FANCA, LV, n = 5) or untreated (FANCA, untreated, n = 5). LME model (Supplementary Table 6). P value: Fanca−/−, LV 5 weeks compared to 45 weeks. c,d, Mean and s.e.m. of white blood cell (WBC; c) and lymphocyte (d) counts in the PB of mice in a and from WT untreated mice. Kruskal–Wallis test with Dunnett’s multiple-comparisons test (compared with WT, untreated). e, Single values and mean and s.e.m. of VCN in the indicated organs 1 year after LV administration in mice in a. f,g, Single VCN values (f) and VCN fold expansion (g; over 4 weeks) in PB of Fanca/ mice transplanted when 8 weeks old with BM cells from FANCA, LV (n = 7) or FANCA, untreated (n = 7) mice in a. LME model (Supplementary Table 7). P value: Fanca−/−, LV 4 weeks compared to 28 weeks. h, Single values and mean and s.e.m. of VCN in indicated organs 1 year after transplant in mice in f. i,j, Single VCN values (i) and VCN fold expansion (j; over 5 weeks) in PB of mice treated as newborns (1.5 × 1010 TU kg1, n = 29) or untreated (n = 14). A subset of FANCA, LV (n = 15) or FANCA, untreated (n = 7) mice received two doses of MMC (arrows). LME model (Supplementary Table 8). P values: Fanca−/−, LV and Fanca−/−, LV, MMC 5 weeks compared to 52 weeks. Two independent experiments. kn, Mean and s.e.m. of neutrophil count (k), red blood cell (RBC) count (l), haemoglobin concentration (HGB, m) and platelet count (n) in PB of mice from i. Kruskal–Wallis test followed by post hoc analysis (compared with FANCA, LV). o, Single values and mean and s.e.m. of VCN in indicated organs 1 year after LV administration in mice from i. Mann–Whitney U-test. p,q, Mean and s.e.m. of VCN (p) and VCN fold expansion (q; over 5 weeks) in PB of mice treated as adults (8-week-old controls n = 6; mobilized n = 5) or at 2 weeks old (controls n = 5; mobilized n = 6) (1.5 × 1010 TU kg1). LME model (Supplementary Table 9). P values: 2 weeks, mobilized and adults, mobilized 5 weeks compared to 15 weeks. Source Data
Fig. 5
Fig. 5. Characterization of cHSPCs in human samples.
a, Mean and s.e.m. of the percentage of different cHSPC populations in the PB of healthy donors of the indicated ages. CMP, common myeloid progenitor cell; ETP, early T cell precursor cell; MKP, megakaryocyte progenitor cell; MLP, multi-lymphoid progenitor cell; pre-BNK, B cell and natural killer cell progenitor cell. Neonates (P0), n = 63; 0–2 months, n = 4; 3–8 months, n = 6; >18 years, n = 21. b,c, Single values and mean and s.e.m. of the absolute count of cHSCs (b) and MPPs (c) in the PB of healthy donors of the indicated ages. Neonates, n = 63; 0–2 months, n = 4; 3–8 months, n = 6; >18 years, n = 21. Kruskal–Wallis test with Dunn’s multiple-comparisons test (compared with the neonate group). HSC and MPP counts from some donors are also reported in a separate study providing a detailed biological characterization of cHSPCs. Source Data
Extended Data Fig. 1
Extended Data Fig. 1. Characterization of the hematopoietic system in mice of different ages and in vivo HSPC gene transfer by LV.
a-d, Mean with SEM of the percentage of different populations among CD45-positive cells in the BM (a), PB (b), spleen (c), or liver (d) of newborn, 1-week-old, 2-week-old, or 8-week-old (adult) C57Bl/6 mice, as indicated. n = 5 mice per group. Newborn PB samples represent 10 pools derived from 50 mice. e, Representative immunohistochemistry image (out of 5 collected) of a liver section from a 1-week-old C57Bl/6 mouse stained with an anti-Ki67 (brown) antibody. Black arrowheads indicate proliferating hematopoietic cells; the red arrowhead indicates a representative megakaryocyte. f, Single VCN values measured in the indicated spleen populations or whole BM from the pooled donor mice shown in Fig. 1k,l. BM cells from 19 LV-treated newborn mice were pooled into five groups (each containing 4–5 mice) for transplantation into five recipient mice after sorting. g, Body weights of individual busulfan-conditioned adult mice that were transplanted (TPX n = 5) or not transplanted (not-TPX, n = 1). The gray area indicates the period of busulfan treatment. Black crosses mark deceased mice. h, Single values of CD45-positive GFP-positive cells in the indicated organs of recipient mice 20 wks post-transplant. VCN values are indicated above the bars. i-l, LV integration site (IS) analysis of GFP-positive cells from LV-treated donor mice and transplanted recipient mice at the study endpoint. Shared IS are color-coded. Clones with an abundance of <1% are shown in gray. The total number of IS detected is indicated above each bar. m, Common integration site analysis of LV-treated and transplanted mice, showing the distribution of integration events relative to known oncogenes. n, Mean with SEM of GFP-positive cells in PBMCs of LV-treated mice as newborns (n = 4) and monitored for 1 year after LV administration (5e10 TU/kg). o, Mean with SEM of GFP-positive cells in PBMCs of LV-treated mice as adults (n = 5, 8-week-old) via i.v. LV administration (8e10 TU/kg). p, Representative immunofluorescence image of the liver from a mouse shown in (o), revealing few-to-no GFP-positive cells. Scale bar: 500 µm. Blue: Hoechst; Green: GFP. Source Data
Extended Data Fig. 2
Extended Data Fig. 2. Gene transfer efficiency into HSPC in 2-week-old C57Bl/6 mice after in vivo LV administration.
a,b, Mean with SEM of GFP-positive cells (a) or VCN (b) measured in the PB of C57Bl/6 mice administered LV (LV, n = 15; 3e10 TU/kg) at 2 weeks-of-age or untreated (Unt, n = 1). c, Single values and mean with SEM of the VCN measured in the indicated organs in Unt and LV mice, 16 weeks after LV administration. d, Single values and mean with SEM of the absolute count of HSCs in the spleen of 2-week-old mobilized (n = 6) or untreated control (n = 7) mice, as indicated. Mann-Whitney test. e,f, Single values and mean with SEM of GFP-positive cells in the thymus (e) or spleen (f) of mobilized (n = 6) or control (n = 7) mice, 20 wks after LV administration. Mann-Whitney test. g,h, Mean with SEM of the engraftment of CD45.2 cells in the PB of CD45.1 recipient mice over time. Controls: n = 5 recipient; Mobilized: n = 6 recipient. Mice were transplanted with 15x106 total BM cells harvested from donor mice, 20 wks after LV administration. i,j, Single values and mean with SEM of the VCN (i) or engraftment of CD45.2 cells (j) measured in CD45.1 recipient mice, 16 wks after transplant in the indicated organs. Mann-Whitney test in (i). k,l, Single values and mean with SEM of GFP-positive cells in the thymus (k), or spleen (l) of CD45.1 recipient mice, 16 wks after transplant. Mann-Whitney test. Source Data
Extended Data Fig. 3
Extended Data Fig. 3. Administration of anti-interferon-α receptor blocking antibody (MAR-1) increase in vivo gene transfer to HSPCs.
a,b, Mean with SEM of GFP-positive cells (a) or the VCN (b) measured over time in the PB of C57Bl/6 mice treated as newborns with MAR-1 (i.v., 50 mg/kg, n = 13) or an IgG control (i.v., 50 mg/kg, n = 13) 3 h before LV administration (8e10 TU/kg). Mann-Whitney test on the last time point analyzed. In (a), comparisons were made among CD45-positive cells. Data from a pool of two independent experiments are shown. c-e, Single values and mean with SEM of GFP-positive cells in the spleen (c), thymus (d), and BM (e) of the mice shown in (a,b) 16 wks after LV administration. Mann-Whitney test. f, Single values and mean with SEM of the VCN measured in the indicated organs, 16 wks after LV administration in the mice shown in (a-e). Mann-Whitney test. Source Data
Extended Data Fig. 4
Extended Data Fig. 4. Characterization of the HSPC compartment in NSG mice of different ages and in vivo HSPC gene transfer by LV.
a, Experimental scheme: hematopoietic cells were collected from the bone marrow (BM), spleen, liver, or peripheral blood (PB) of newborn, 1-week-old, 2-week-old, or adult NSG mice and analyzed by FACS to evaluate the composition of total CD45-positive cells. n = 5 mice per group. Newborn PB samples from 40 mice were pooled into eight groups. b-e, Mean with SEM of the percentage of different populations among lineage-negative (Lin-) and cKit-positive (cKit+) cells in the BM (b), PB (c), spleen (d), or liver (e) of the indicated NSG mice. HSC: hematopoietic stem cells; MPP: multipotent progenitor cells; GMLP: granulocyte-monocyte-lymphoid progenitor cells; KSL: cKit+ Sca1+ Lin- cells; LK CD150: Lin- cKit+ CD150+ cells; EP: erythroid progenitor cells; MEP: megakaryocyte-erythroid progenitor cells; GMP: granulocyte-monocyte progenitor cells. n = 5 mice per group. Newborn PB samples from 40 mice were pooled into eight groups. f-i, Single values and mean with SEM of the absolute count of HSCs in the BM (f), PB (g), spleen (h), or liver (i) of the indicated NSG mice. n = 5 mice per group. Newborn PB samples from 40 mice were pooled into eight groups. Kruskal-Wallis test with Dunn’s multiple comparisons test (comparison to the newborn group). j, Mean with SEM of the count of HSPC red or white colonies grown from GFP-positive (GFPpos) or GFP-negative (GFPneg) Lin- cells isolated from the BM of the mice in Fig. 2k–m, 20 wks after LV administration. k, Single VCN values measured in FACS-sorted GFPpos or GFPneg Lin- cells isolated from mice shown in Fig. 2m,n and cultured for 72 h. l, Single VCN values measured from single-picked red (RFC) or white (WFC) colonies grown in MethoCult from GFPpos or GFPneg FACS-sorted Lin- cells isolated from the mice shown in Fig. 2m,n. m, Single values and mean with SEM of the GFP-positive area measured by immunohistochemistry in the indicated tissues, 20 wks after LV administration in NSG mice treated as newborns (n = 6) or adults (n = 4) with CD47hi-LV (shown in Fig. 2m,n), or untreated (Unt, n = 3). n, Representative immunohistochemistry images of the indicated tissues taken from the mice shown in (m). GFP-positive cells are shown in brown (black arrowheads). Scale bar: 300 µm. Schematics in a created with BioRender (https://biorender.com). Source Data
Extended Data Fig. 5
Extended Data Fig. 5. Gene transfer efficiency into HSPC in 2-week-old mice after in vivo LV administration.
a-c, Single values and mean with SEM of the absolute HSC counts in the BM (a), PB (b), or spleen (c) of 2-week-old or adult mobilized (n = 5 per group) or untreated (n = 2 per group) NSG mice, as indicated. Mann-Whitney test. d,e, Single values and mean with SEM of GFP-positive cells measured in the indicated populations in the spleen (d) or BM (e) of the mice shown in Fig. 2o, 16 wks after LV administration. Kruskal-Wallis test with Dunn’s multiple comparisons (comparison to the 2-week-old control group). f, Single values and mean with SEM of the VCN measured in the indicated organs of the mice shown in Fig. 2o, 16 wks after LV administration. Kruskal-Wallis test with Dunn’s multiple comparisons (comparison to the respective 2-week-old control groups). Source Data
Extended Data Fig. 6
Extended Data Fig. 6. In vivo HSPC gene transfer in ADA-SCID mice by ADA-LV.
a, Mean with SEM of the weight over time of mice shown in Fig. 3b. b,c, Mean with SEM of neutrophil (b) or monocyte (c) counts measured by hemocytometer in the PB of ADA-SCID mice treated with the indicated LV as newborns. The number of mice at each time point is reported below the graphs. LME model (only comparisons vs. WT and p-values < 0.05 are reported; complete analyses in Supplementary Tables 10, 11). d,e, Single values and mean with SEM of ADA activity measured over time in the PB cellular fraction (d) or plasma (e) from ADA-SCID or wild-type (WT) mice treated with the indicated LV or left untreated. LME model (only comparisons vs. WT and p-values < 0.05 are reported; complete analyses in Supplementary Tables 12, 13). f, Single values and mean with SEM of LV-RNA expression in the indicated organs or liver subpopulations 8 wks after administration of the indicated LV to newborn ADA-SCID mice (n = 5 per group, 2e10 TU/kg). Wpre: Woodchuck hepatitis virus post-transcriptional regulatory element, used to measure LV genome expression. Kruskal-Wallis test with Dunn’s multiple comparisons test (comparison to the PGK.ADA group). g, Mean with SEM of the weights of the mice shown in Fig. 3h. h, Single values and mean with SEM of the engraftment of cells isolated from ADA-SCID or WT mice treated with the indicated LV as newborns and used as donors for irradiated NSG mice. LV-treated WT mice have been pooled, irrespective of the administered LV. i,j, Mean with SEM of the percentage of the indicated populations among CD45-positive cells in the PB of transplanted NSG mice, 8 (i) or 12 wks (j) after transplant. k, Mean with SEM of the VCN measured in the PB of NSG-transplanted or untreated (Unt) mice over time. LME model (only comparisons vs. WT and p-values < 0.05 are reported; complete analyses in Supplementary Table 14). l, Representative LV integration site analysis of cells from one LV-treated newborn ADA-SCID mouse, 20 wks after PGK.ADA-LV administration (see Fig. 3b, left panel) and the corresponding NSG recipient mouse, 12 wks after transplant (see Fig. 3h, right panel). Shared integrations are color-coded. Clones with abundance <1% are shown in grey. The total number of integrations is reported on top of the bars. m,n, Survival (m) and individual body weights (n) of ADA-SCID mice treated at 2 weeks-of-age with PGK.ADA-LV (n = 5, 2.5e10 TU/kg) compared to WT (WT, n = 2) littermates. Source Data
Extended Data Fig. 7
Extended Data Fig. 7. In vivo HSPC gene transfer in osteopetrotic newborn mice.
a, Survival of LV-treated osteopetrotic (OC-LV, n = 11) or WT mice (WT-LV, n = 27) treated as newborns with PGK.TCIRG1-LV (1-2e10 TU/kg) compared to untreated OC mice (OC-unt, n = 8) mice. b, Single values of the weight of OC-LV or WT-LV mice over time post LV treatment. c,d, Mean with SEM of white blood cell (WBC, c) or lymphocyte (d) counts measured by hemocytometer in the PB of OC-LV (n = 10) or, WT-LV (n = 16) mice, or untreated WT (WT-unt) mice (n = 3) over time. Sample sizes (n) at each time point are reported below the graphs. e, Mean with SEM of the VCN measured in the PB of OC-LV (n = 9), WT-LV mice (n = 15), or WT-unt mice (n = 3) over time. Sample sizes (n) at each time point are reported below the graphs. Šídák’s multiple comparisons test. f, Single values and mean with SEM of the total cell count isolated at necropsy from the BM or spleen of OC-LV (n = 7) or WT-LV (n = 15) mice. Mann-Whitney test. g,h, Single values and mean with SEM of the indicated populations among CD45-positive cells analyzed at necropsy in the spleen (g) or BM (h) of OC-LV (n = 7) or WT-LV (n = 15) mice. i, Single values and mean with SEM of the VCN measured in the indicated organs at necropsy in OC-LV (n = 9), WT-LV mice (n = 14), or WT-unt mice (n = 4). Mann-Whitney test. j, Representative images of toluidine blue staining of dentine discs after a resorption assay of osteoclasts differentiated from the BM of LV-treated WT or OC mice, as indicated. The purple area represents resorbed dentine. Scale bar: 200 µm. k, Single values and mean with SEM of C-terminal telopeptide (CTX) measured in the medium of osteoclast cultures from OC-LV (n = 5) or WT-LV (n = 4) mice following dentine resorption. l-o, Representative micro-tomography scans (l) or single values and mean with SEM of the quantification of bone mineral density (m), bone volume fraction (n), and trabecular separation (o) of WT-LV (n = 7), OC-LV-treated (n = 8), or WT-unt (n = 1) mice. Asterisks indicate the longest-surviving OC-LV mice, one of which is also shown in the bottom-left panel in (l). Scale bar: 500 µm. p, Single values and mean of parathyroid hormone (PTH) concentration in the serum of OC-LV (n = 10) or WT-LV (n = 7) mice at the indicated time points. Sample sizes (n) at each time point are reported below the graphs. Source Data
Extended Data Fig. 8
Extended Data Fig. 8. In vivo HSPC gene transfer in Fanca-/- mice by PGK.FANCA-LV.
a, Mean with SEM of the percentage of different populations among lineage-negative (Lin-) and cKit-positive (cKit + ) cells (HSPCs) in the PB of newborn, 2-week-old, or 8-week-old (adult) Fanca-/- mice, as indicated. HSC: hematopoietic stem cells; MPP: multipotent progenitor cells; GMLP: granulocyte-monocyte-lymphoid progenitor cells; KSL: cKit+ Sca1+ Lin- cells; LK CD150: Lin- cKit+ CD150+ cells; EP: erythroid progenitor cells; MEP: megakaryocyte-erythroid progenitor cells; GMP: granulocyte-monocyte progenitor cells. b, Single values and mean with SEM of the absolute count of HSCs in the PB of newborn, 2-week-old, or 8-week-old Fanca-/- mice, as indicated. n = 5 mice per group. Newborn PB samples represent six pools from 30 mice. Kruskal-Wallis test with Dunn’s multiple comparisons test (comparison to the newborn group). c-e, Mean with SEM of neutrophil (c), monocyte (d), or platelet (e) counts measured by hemocytometer in the PB of LV-treated (FANCA-LV) or untreated (FANCA-unt) Fanca-/- mice (n = 5) or untreated wild-type (WT-unt) mice (n = 5). Kruskal-Wallis test with Dunnett’s multiple comparisons test (comparison to WT). f, Single values and mean with SEM of the VCN measured after FACS-sorting cell populations from PB or BM of the mice shown in Fig. 5a–e, 1year after LV administration. g, Representative LV integration site (IS) analysis of cells from one LV-treated newborn Fanca-/- mouse, 20 wks after PGK.FANCA-LV administration (shown in Fig. 5a–e). Shared integrations among the indicated organs or FACS-sorted populations from PB or BM are color-coded. Clones with an abundance <1% are shown in grey. The total number of integrations is reported on top of the bars. h, Representative heatmap showing shared integrations (columns) in the indicated organs or FACS-sorted populations isolated from a PGK.FANCA-LV-treated mouse (shown in Fig. 5a–e). “Sample count” refers to the number of samples (rows) that share a given IS. Source Data

References

    1. Ferrari, G., Thrasher, A. J. & Aiuti, A. Gene therapy using haematopoietic stem and progenitor cells. Nat. Rev. Genet.22, 216–234 (2021). - PubMed
    1. Naldini, L. Genetic engineering of hematopoiesis: current stage of clinical translation and future perspectives. EMBO Mol. Med.11, e9958 (2019). - PMC - PubMed
    1. Ferrari, S. et al. Genetic engineering meets hematopoietic stem cell biology for next-generation gene therapy. Cell Stem Cell30, 549–570 (2023). - PubMed
    1. Ferrari, S. & Naldini, L. A step toward stem cell engineering in vivo. Science381, 378–379 (2023). - PubMed
    1. Richter, M. et al. In vivo transduction of primitive mobilized hematopoietic stem cells after intravenous injection of integrating adenovirus vectors. Blood128, 2206–2217 (2016). - PMC - PubMed

MeSH terms

Substances