. 2025 Jun;642(8069):999-1006.
doi: 10.1038/s41586-025-09048-1. Epub 2025 May 28.

The pivot penalty in research

Affiliations

The pivot penalty in research

Ryan Hill et al. Nature. 2025 Jun.

Abstract

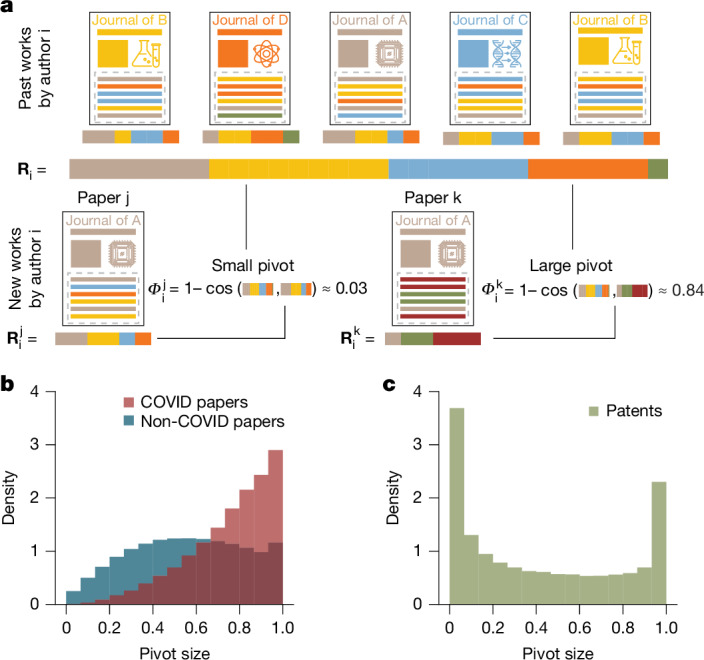
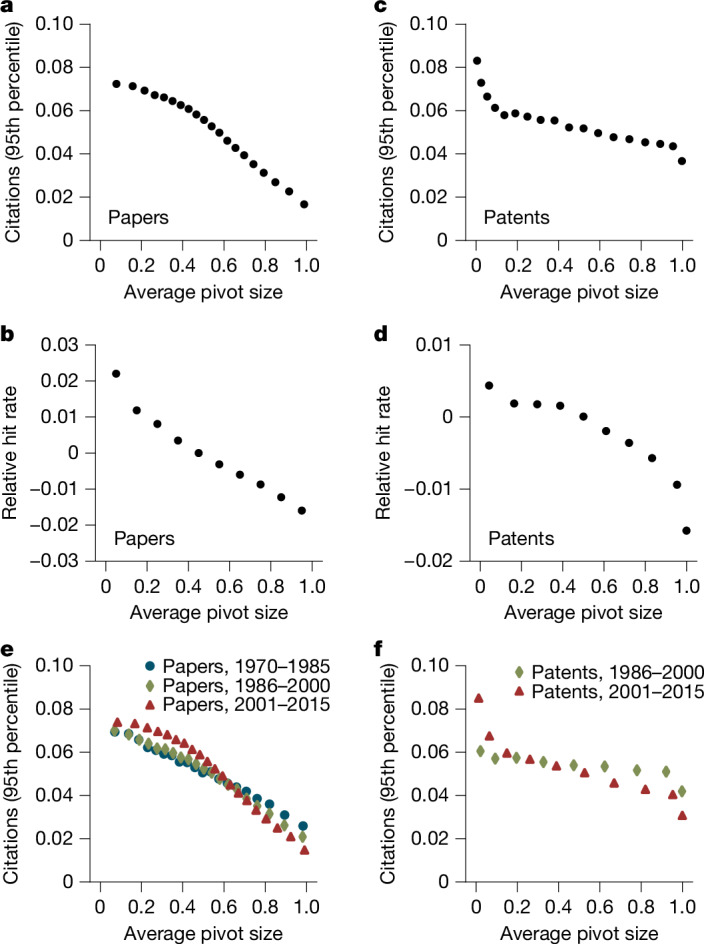
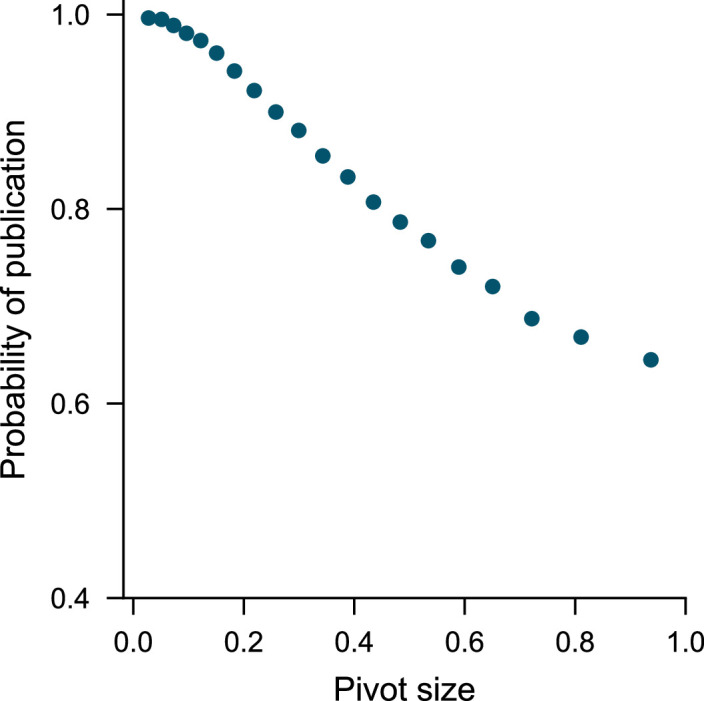
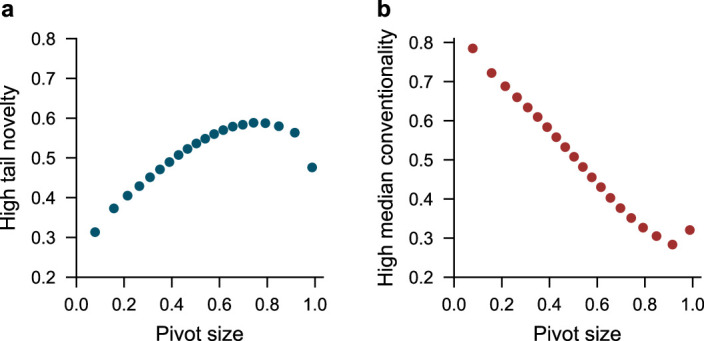
Scientists and inventors set the direction of their work amid evolving questions, opportunities and challenges, yet the understanding of pivots between research areas and their outcomes remains limited1-5. Theories of creative search highlight the potential benefits of exploration but also emphasize difficulties in moving beyond one's expertise6-14. Here we introduce a measurement framework to quantify how far researchers move from their existing work, and apply it to millions of papers and patents. We find a pervasive 'pivot penalty', in which the impact of new research steeply declines the further a researcher moves from their previous work. The pivot penalty applies nearly universally across science and patenting, and has been growing in magnitude over the past five decades. Larger pivots further exhibit weak engagement with established mixtures of prior knowledge, lower publication success rates and less market impact. Unexpected shocks to the research landscape, which may push researchers away from existing areas or pull them into new ones, further demonstrate substantial pivot penalties, including in the context of the COVID-19 pandemic. The pivot penalty generalizes across fields, career stage, productivity, collaboration and funding contexts, highlighting both the breadth and depth of the adaptive challenge. Overall, the findings point to large and increasing challenges in effectively adapting to new opportunities and threats, with implications for individual researchers, research organizations, science policy and the capacity of science and society as a whole to confront emergent demands.


Conflict of interest statement

Competing interests: The authors declare no competing interests.

Figures

Fig. 1
Fig. 1. Quantifying research pivots.
a, The pivot measure compares a focal work against previous works by the same researcher. An increasing value on the [0,1] interval indicates a larger pivot from the researcher’s previous work. In the sciences, journals are used to define research areas (pictured); in patenting, technology classes are used. b, The distribution of author pivots in 2020 (n = 8.32 million author-by-paper observations) is dispersed across the [0, 1] interval. c, The distribution of inventor pivots in 2020 (n = 166,000 inventor-by-patent observations) is dispersed across the [0, 1] interval and is bimodal. COVID-19 papers (b) showed higher median pivots than other papers in 2020. Fig. 1a, icons adapted from the Noun Project (https://thenounproject.com). Source data
Fig. 2
Fig. 2. The pivot penalty.
a, In a study of 25.8 million papers published from 1970 to 2015, papers with higher pivot size have substantially lower probabilities of being high impact. b, For a particular author, relative impact for their papers declines steeply with pivot size. c, In a study of 1.72 million US patents granted from 1980 to 2015, patents with higher pivot size have substantially lower probabilities of being high impact. d, For a particular inventor, relative impact for their patents declines with pivot size. e,f, Over time, the relationship between pivot size and high-impact works has become increasingly negative in science publishing (e) and patenting (f). Source data
Fig. 3
Fig. 3. Pivots and retraction events.
a, This difference-in-differences analysis compares treated scientists who directly cite a paper before its retraction with control scientists who cited other papers in the same journal and year as the retracted paper, but not the retracted paper. There are 164,988 treated authors who cited a retracted paper at least once (18,505 treated authors who cited it at least twice) before its retraction but are not themselves authors of the retracted papers. Pivot size and impact of papers from these treated scientists is compared with papers from equal numbers of matched control scientists before and after the year of retraction. b, Pivot size significantly increases for treated scientists relative to control scientists after the retraction (0.025 ± 0.001 s.e. pivot-size increase, P < 0.0001, regression, n = 5.82 million author-by-paper observations). The effect is larger when focusing on scientists who cited the retracted paper at least twice (0.037 ± 0.001 s.e. pivot-size increase, P < 0.0001, regression, n = 2.96 million author-by-paper observations). c, Hit rates fall for treated scientists after retraction (−0.004 ± 0.001, P < 0.0001, n = 5.82 million), and again the effect is stronger for those citing the retracted paper at least twice (−0.007 ± 0.001, P < 0.0001, n = 2.96 million). d,e, Year-by-year analysis comparing treated and control authors further shows that the increase in pivot size is statistically significant (P < 0.001) starting immediately in the retraction year (d) and the decrease in hit rate becomes statistically significant (P < 0.05) starting the year after the retraction (e). In be, bars and markers represent the difference-in-differences regression coefficients, and the whiskers show the 95% confidence interval derived from the regression standard errors (see Difference-in-differences). Fig. 3a, icons adapted from Apple. Source data
Fig. 4
Fig. 4. Pivots and the COVID-19 pandemic.
a, Science rapidly shifted to COVID-19 (COVID) research in 2020, when COVID-19 publications rose to 4.5% of all science publications in May 2020 and maintained high rates thereafter. b, Health sciences and social sciences featured the strongest responses, but all scientific fields engaged in COVID-19 research. c, Scientists who wrote COVID-19 papers pivoted to a greater extent than they did in their previous work, in their other 2020 work, or than matched control scientists did. d, Comparing COVID-19 and non-COVID-19 papers in each field in 2020, unusually large pivots have been a universal feature of COVID-19 research. e, COVID-19 papers experienced an impact premium, but the pivot penalty appeared in both COVID-19 and non-COVID-19 work. Comparing at the median pivot sizes (dashed lines), the COVID-19 impact premium was substantially offset by the pivot penalty, given its larger median pivot size. f,g,h, Engaging new collaborators was particularly common for COVID-19 researchers, who worked with new collaborators to an unusual degree compared with their own previous work, their other 2020 publications and with control scientists (f). Nonetheless, the pivot penalty persisted for big and small teams (g) and when engaging new or existing co-authors (h). i,j, Higher-pivot work was substantially less likely to acknowledge funding support in the sciences as a whole (blue) and among COVID-19 papers (red). COVID-19 papers were particularly unlikely to acknowledge grant support (i), yet the pivot penalty appeared even among both funded work and non-funded work (j). k, Although individual, collaborative and funding features sharply conditioned the adaptive response of science, in regression analysis they did not individually or collectively overcome the fundamental pivot penalty. Coronavirus icon adapted from the Noun Project (https://thenounproject.com). Source data
Extended Data Fig. 1
Extended Data Fig. 1. The pivot penalty in science and invention over time, within individual researchers.
Using a 5% subsample of paper authors and all patent inventors, we divide the data into two periods, 1986–2000 (n = 5.7 million author-paper pairs, n = 568 thousand inventor-patent pairs) and 2001–2015 (n = 23.2 million author-paper pairs, n = 2.0 million inventor-patent pairs). In each period, we run regressions with individual fixed effects. (a-d) The relationship between hit rates and pivot size is estimated non-parametrically, with fixed effects for different ranges of pivot size. The figures present the coefficient for each pivot size group, with indicated 95% confidence intervals. The slope of the pivot penalty is increasing over time when looking within individual researchers. For papers, the recent period (b) shows a monotonic decrease in hit rate with pivot size, within the body of work of individual researchers (confidence intervals are too small to be seen). The earlier period (a) similarly shows a monotonic decrease in hit rate with pivot size, but the slope of the relationship is shallower. For patents, the recent period (d) shows a monotonic decrease in hit rate with pivot size, within the body of work of individual researchers. The earlier period (c) has noisier estimates, with a flatter relationship to pivot size and potential non-monotonicity, but where high pivots face large impact penalties. Overall, we see an increasingly steep pivot penalty with time. Source data
Extended Data Fig. 2
Extended Data Fig. 2. The pivot penalty over alternative time horizons.
The baseline pivot penalty (Fig. 2a) uses the hit rate measure, normalizing impact by field and publication year, providing one means for addressing different time horizons for citations from different publication years. Alternatively, for the same data (n = 25.8 million papers published from 1970–2015), one can count and normalize citations received over a fixed window of time after the publication year. (b-d) Hit rates are computed using citations received by each paper over, alternatively, (b) 2 year, (c) 5 year, and (d) 10 year forward windows. The pivot penalty is robust using all of these alternatives. Source data
Extended Data Fig. 3
Extended Data Fig. 3. The pivot penalty with smoother citation measures.
In addition to binary measures of impact, one can consider more continuous measures using the same data (n = 25.8 million published from 1970–2015). In (a) we normalize each paper’s citation count as a ratio to the mean citations for papers in that field and publication year. Citations are approximately 30% above the field mean for low pivot papers on average and 55% below the field mean for the highest pivot papers on average. In (b) we normalize each paper’s citations by its percentile in the citation distribution for all papers published in the same field and year. The pivot penalty is also robust to this measure of impact. Source data
Extended Data Fig. 4
Extended Data Fig. 4. Quantifying pivot size using various levels of patent technology classification.
For patents granted from 1975–2015, the pivot size distribution is bimodal, with more weight on pivots of size zero and one (n = 3.3 million inventor-by-patent observations). The average pivot size increases as the definition of technology class used to calculate pivoting narrows. The available levels of technology class are: (a) 9 sections (e.g., “B”), (b) 128 classes (e.g., “B29”), (c) 662 subclasses (e.g., “B29C”), (d) 9,987 groups (e.g., “B29C45”), and (e) 210,347 subgroups (e.g., “B29C45/64”). The main analysis in Figs. 1 and 2 use level-4 groups to define pivot size. Source data
Extended Data Fig. 5
Extended Data Fig. 5. Patent references to papers.
The probability that an academic paper is referenced by at least one patent declines at larger pivot sizes. The data considers 37 million papers published from 1970–2019. Panel (a) considers raw data, with no controls, and indicates non-monotonicity at lower pivot sizes. Panel (b) considers the relationship net of level-1 field fixed effects, which accounts for the fact that some fields (e.g., astronomy) are far less likely to be referenced in patents than others (e.g., nanotechnology). As seen in the figure, controlling for field largely eliminates the non-monotonicity. Comparing the highest and lowest pivot size bins in (b), the probability of being cited in a patented invention declines by 43% (p < .001 in two-sample t-test of means). Source data
Extended Data Fig. 6
Extended Data Fig. 6. Successful publication.
This figure analyzes all 1.07 million preprints released from 2015–2018 on preprint databases such as arXiv and SSRN. For each preprint, we examine whether it has been published within a five-year window from its preprint date. Virtually all low pivot size papers are published. But publication success declines smoothly with pivot size. Comparing the highest and lower pivot size bins, the publication success rate declines by 35% (p < .001 in two-sample t-test of means). The monotonic decline in publication success provides a further dimension of the pivot penalty. See Section S2.3.3 for further discussion. Source data
Extended Data Fig. 7
Extended Data Fig. 7. Patent market value.
The estimated market value of patents is decreasing in average pivot size. Market value is estimated using changes in stock prices around the announcement of patent grants for public companies. The sample is 802,599 patents published between 1980 and 2015 that were granted to public corporations. Market valuations are as calculated in. Comparing the highest and lowest pivot size bins, market value declines by 29% (p < .001 in two-sample t-test of means). Source data
Extended Data Fig. 8
Extended Data Fig. 8. Novelty, conventionality and pivot size.
The probability that a paper is characterized by (a) high tail novelty or (b) high median conventionality in relation to pivot size. Measures are calculated using combinations of references in new academic papers, examining 20.8 million papers over the 1970–2015 period. Overall, novelty is increasing with pivot size while conventionality decreases. A researcher who is pivoting not only does something new personally but also tends to combine prior knowledge in a way that is unusual in science. At the same time, high pivots are associated with distinctly low conventionality, consistent with a weaker grounding in conventional domain knowledge. Source data
Extended Data Fig. 9
Extended Data Fig. 9. COVID share by subfield.
This figure reports COVID-19 papers as a fraction of all 2020 publications in specific level-1 fields. Presented here are the 20 medical and 20 non-medical level-1 fields that have the highest fraction of COVID papers. Source data
Extended Data Fig. 10
Extended Data Fig. 10. Quantifying pivot size using an author’s full publication record.
In the main text, we measure pivot size comparing the author’s focal paper with that author’s prior three years of work. Here we examine pivot size using the entire history of that author’s work (n = 8.43 million author-paper pairs). (a) The large shift in pivot size for COVID papers is evident when pivot size is measured by comparing 2020 papers to all past work. This shift is comparable to Fig. 1b, where pivot size is measured using only papers published in the prior three years. (b) The negative relationship between pivot size and impact is similar in slope when using the full career pivot metric here or the 3-year metric as shown in Fig. 4e. Source data

References

    1. Bush, V. Science, the Endless Frontier: A Report to the President (US Government Printing Office, 1945).
    1. Omenn, G. S. Grand challenges and great opportunities in science, technology, and public policy. Science314, 1696–1704 (2006).
    1. Ahmadpoor, M. & Jones, B. F. The dual frontier: patented inventions and prior scientific advance. Science357, 583–587 (2017). - PubMed
    1. Yang, P. & Wang, X. COVID-19: a new challenge for human beings. Cell. Mol. Immunol.17, 555–557 (2020). - PMC - PubMed
    1. Field, C. B. et al. (eds) Managing the Risks of Extreme Events and Disasters to Advance Climate Change Adaptation: Special Report of the Intergovernmental Panel on Climate Change (Cambridge Univ. Press, 2012). - PubMed

MeSH terms