. 2025 Jul;22(7):1556-1567.
doi: 10.1038/s41592-025-02712-4. Epub 2025 May 28.

InterpolAI: deep learning-based optical flow interpolation and restoration of biomedical images for improved 3D tissue mapping

Affiliations

InterpolAI: deep learning-based optical flow interpolation and restoration of biomedical images for improved 3D tissue mapping

Saurabh Joshi et al. Nat Methods. 2025 Jul.

Abstract

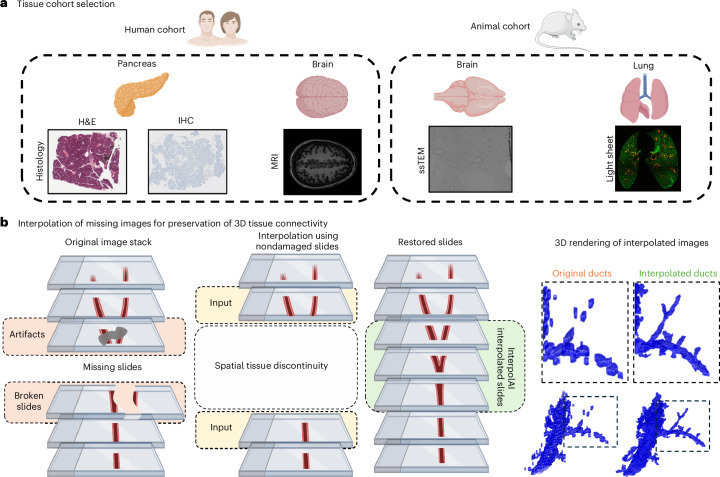
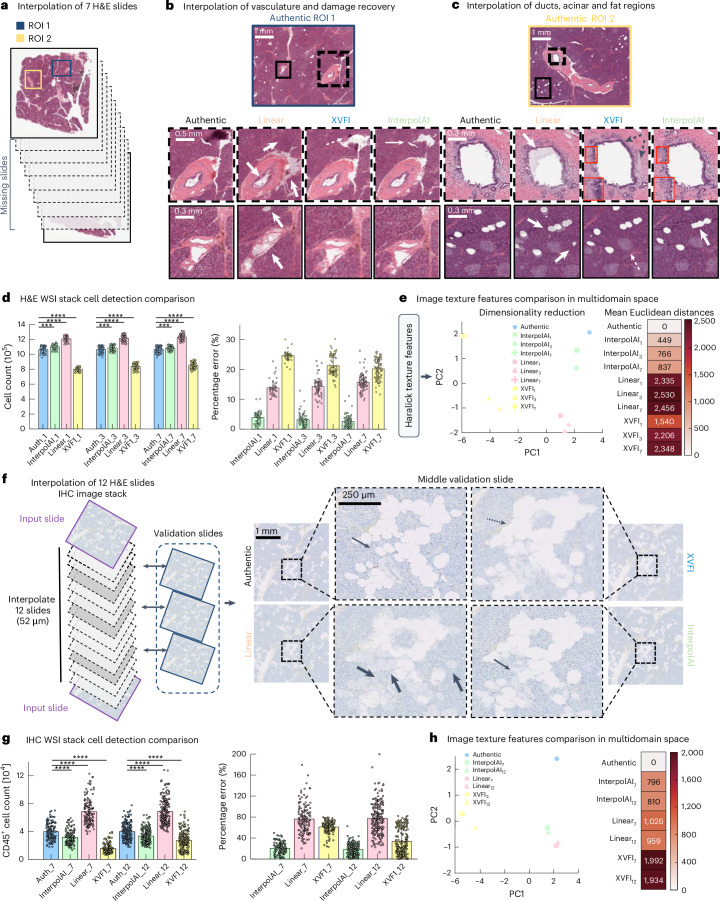
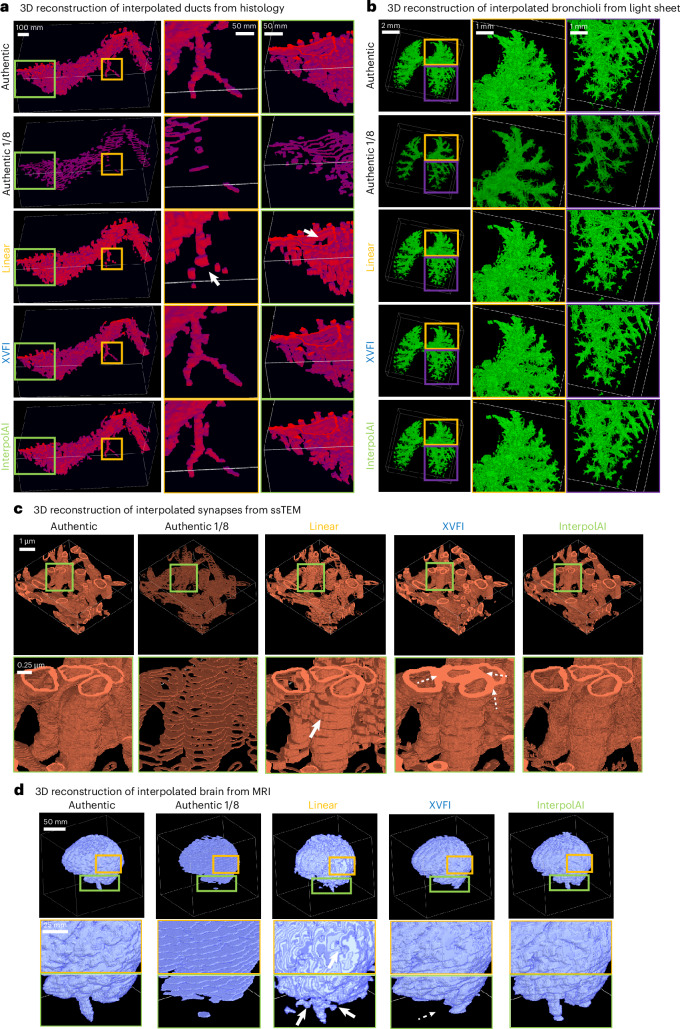
Recent advances in imaging and computation have enabled analysis of large three-dimensional (3D) biological datasets, revealing spatial composition, morphology, cellular interactions and rare events. However, the accuracy of these analyses is limited by image quality, which can be compromised by missing data, tissue damage or low resolution due to mechanical, temporal or financial constraints. Here, we introduce InterpolAI, a method for interpolation of synthetic images between pairs of authentic images in a stack of images, by leveraging frame interpolation for large image motion, an optical flow-based artificial intelligence (AI) model. InterpolAI outperforms both linear interpolation and state-of-the-art optical flow-based method XVFI, preserving microanatomical features and cell counts, and image contrast, variance and luminance. InterpolAI repairs tissue damages and reduces stitching artifacts. We validated InterpolAI across multiple imaging modalities, species, staining techniques and pixel resolutions. This work demonstrates the potential of AI in improving the resolution, throughput and quality of image datasets to enable improved 3D imaging.


Conflict of interest statement

Competing interests: The authors declare no competing interests.

Figures

Fig. 1
Fig. 1. Interpolation workflow and test datasets.
a, Samples were obtained from two species, mouse and human. Four different organs were analyzed: human pancreas, human brain, mouse brain and mouse lung. Five imaging modalities were tested: H&E-stained histological slides, IHC stained histological slides, MRI, serial ssTEM slides and combined tissue clearing and light-sheet microscopy. b, Aligned slides are manually searched through to identify missing or damaged slides, and damaged slides are removed from the stack of slides. InterpolAI interpolation is performed using the sections adjacent to the damaged or missing slides as inputs to recreate slides that were stained differently, missing or damaged, resulting in a uniform stack of slides. Using CODA, slides are segmented into labeled tissue masks, with each label representing a different microanatomical structure in the slide, which is then used to recreate and visualize microanatomical 3D structures in the tissue sample. Illustrations created using BioRender.com.
Fig. 2
Fig. 2. Comparison of linear, XVFI and InterpolAI interpolations for pancreatic histology image stacks.
a, ROI were selected from WSIs to include all microanatomical features (islets, ducts, vessels, fat, acini, ECM and PanIN). Slides were interpolated, skipping seven slides between adjacent sections, generating seven slides. b, ROI 1 shows a comparison of interpolated to the authentic ROI for the middle-interpolated image for ducts and vessels. Arrowheads show linear interpolation replacing damage with acini as opposed to whitespace, creating noise around the ducts, incorrectly generating fat and unable to preserve vessel structure. Dashed arrows show XVFI removed damage, kept some black damage artifacts and incorrectly generated hued acini within the interpolated whitespace. Arrow shows InterpolAI correctly restored whitespace. c, ROI 2 shows a comparison of interpolated to the authentic ROI for the middle-interpolated image for ducts, fat and vessels. Arrowheads show linear interpolation creates duct lumen and fat shadows resembling islets as well as nonexistent fat regions. Red boxes show XVFI was unable to interpolate cellular information unlike InterpolAI. Dashed arrows show XVFI created a purple hued band, lacking cell nuclei around the lumen of the duct. d, Cell counts comparison between authentic H&E and interpolated images, and percentage error in cell counts. e, PCA of 13 Haralick features for authentic, and interpolated images for various numbers of skipped images. Mean Euclidean distance of interpolated images from authentic images based on 13 Haralick features. f, IHC slides were interpolated and compared to authentic slides for validation. Middle slide is compared with the interpolated images. Arrow shows InterpolAI preserves vessel structure, unlike linear interpolation, which was also unable to preserve fat domains such as XVFI (arrowheads and dashed arrow). g, Comparison of CD45+ cell counts in authentic images and interpolated images when skipping 7 and 12 slides. h, PCA of 13 Haralick features for authentic and interpolated IHC images for various numbers of skipped images. Mean Euclidean distance of interpolated images from authentic images is based on 13 Haralick features. Error bars represent mean ± s.d. *P ≤ 0.05, **P ≤ 0.01, ***P ≤ 0.001, ****P ≤ 0.0001. Supplementary Table 2 for exact P values calculated via two-tailed Mann–Whitney U-test, mean and s.d.
Fig. 3
Fig. 3. InterpolAI interpolation for stacks of MRI and light-sheet microscopy images.
a, Tissue-cleared light-sheet images were interpolated skipping seven slides between adjacent sections, thereby generating seven slides. b, Qualitative comparison of linear, XVFI and InterpolAI interpolations to the authentic image for the middle-interpolated light-sheet image (image 4). Arrowhead shows linear interpolation creates double boundary lines around bronchioles. In the second row, the arrowhead shows photobleaching in authentic reduced by linear interpolation and completely removed by InterpolAI (arrow). Dashed arrow shows XVFI reduced photobleaching but did not remove it. Second dashed arrow shows XVFI elongated the right edge of a bronchiole. c, PCA of 13 Haralick features for authentic, linear, XVFI and InterpolAI-interpolated light-sheet images for various numbers of skipped light-sheet images. Mean Euclidean distance of interpolated images from authentic images based on 13 Haralick features. d, Euclidean distance by slide of interpolated images from authentic images based on 13 Haralick features for various numbers of skipped light-sheet images.
Fig. 4
Fig. 4. InterpolAI interpolation for a stack of ssTEM images.
a, ssTEM slides were interpolated while skipping four slides between adjacent sections, thereby generating four slides. b, InterpolAI interpolation of mouse brain ssTEM slides to remove damage from slides (arrowheads) and reduce stitching artifacts (red box). c, PCA of 13 Haralick features for authentic, linear, XVFI and InterpolAI-interpolated ssTEM images for various skipped images. Mean Euclidean distance of interpolated images from authentic images based on 13 Haralick features.
Fig. 5
Fig. 5. InterpolAI interpolation for a stack of MRI images.
a, MRI images were interpolated while skipping seven slides between adjacent sections, thereby generating seven slides. b, Qualitative comparison of linear, XVFI and InterpolAI interpolation to the authentic image for the middle-interpolated MRI (image 4). The circled region shows linear interpolation creates band artifacts, unlike XVFI and InterpolAI. c, PCA of 13 Haralick features for authentic, linear, XVFI and InterpolAI-interpolated MRI images for various numbers of skipped images. Mean Euclidean distance of interpolated images from authentic images based on 13 Haralick features. d, Euclidean distance by slide of interpolated images from authentic images based on 13 Haralick features for various numbers of skipped MRI images.
Fig. 6
Fig. 6. 3D reconstructions of interpolated images.
a, Comparison of 3D reconstructions of human pancreatic duct from a stack of H&E sections, when skipping seven slides between authentic images and when interpolating the missing slides using linear, XVFI and InterpolAI interpolations. b, Comparison of 3D reconstructions of bronchioles from light-sheet images of the mouse lung when skipping seven images between authentic images and when interpolating the missing slides using linear, XVFI and InterpolAI interpolations. c, Comparison of 3D reconstructions of synapses from ssTEM slides of the mouse brain when skipping seven images between authentic images and when interpolating the missing slides using linear, XVFI and InterpolAI interpolations. d, Comparison of 3D reconstructions of brain MRI images when skipping seven images between authentic images and when interpolating the missing slides using linear, XVFI and InterpolAI interpolations.
Extended Data Fig. 1
Extended Data Fig. 1. A Fundamental comparison between GANs and InterpolAI interpolation.
GANs translate an H&E stained slide to a slide stained with IHC and vice versa (top panel). InterpolAI interpolates multiple novel slides between two input slides, restoring tissue connectivity (bottom panel). Illustrations created using BioRender.com.
Extended Data Fig. 2
Extended Data Fig. 2. Qualitative comparison of linear and InterpolAI interpolations to authentic H&E-stained histological slides of a human pancreas when skipping 7 slides for four different ROI’s.
(a) Four ROIs were selected from H&E-stained whole slide images (WSI’s). Slides were interpolated when skipping 7 slides between adjacent sections, thereby generating 7 slides. (b) The top row of authentic images shows the middle skipped z-slide of all four different ROIs selected for interpolation. The middle row of zoom-ins of authentic images shows microanatomical structures observed within the different ROI’s. The third row of zoom-ins shows the CODA classification of these microanatomical structures. (c) The top row of linearly interpolated images shows the middle interpolated z-slide of all four different ROI’s corresponding to the authentic images. The middle row of zoom-ins of linearly interpolated images shows microanatomical structures generated by linear interpolation within the different ROI’s. The third row of zoom-ins shows the CODA classification of these linearly interpolated microanatomical structures. (d) The top row of InterpolAI interpolated images shows the middle interpolated z-slide of all four different ROI’s corresponding to the authentic images. The middle row of zoom-ins of InterpolAI interpolated images shows microanatomical structures generated by InterpolAI within the different ROI’s. The third row of zoom-ins shows the CODA classification of these InterpolAI interpolated microanatomical structures. (e) Euclidean distance by slide of interpolated images from authentic images based on thirteen Haralick features for ROI 1 and ROI 2. (f) Percent error in CD45+ cell count by slide between authentic and interpolated images when skipping 12 slides.

Update of

References

    1. Forjaz, A. et al. Three-dimensional assessments are necessary to determine the true spatial tissue composition of diseased tissues. Preprint bioRxiv10.1101/2023.12.04.569986 (2023).
    1. Kiemen, A. L. et al. CODA: quantitative 3D reconstruction of large tissues at cellular resolution. Nat. Methods19, 1490–1499 (2022). - PMC - PubMed
    1. Cline, H. E., Dumoulin, C. L., Hart, H. R., Lorensen, W. E. & Ludke, S. 3D reconstruction of the brain from magnetic resonance images using a connectivity algorithm. Magn. Reson. Imaging5, 345–352 (1987). - PubMed
    1. The MICrONS Consortium. Functional connectomics spanning multiple areas of mouse visual cortex. Nature640, 435–447 (2025). - PMC - PubMed
    1. Yin, W. et al. A petascale automated imaging pipeline for mapping neuronal circuits with high-throughput transmission electron microscopy. Nat. Commun.11, 4949 (2020). - PMC - PubMed

LinkOut - more resources