. 2025 Jul;22(7):1436-1446.
doi: 10.1038/s41592-025-02708-0. Epub 2025 May 28.

SAVANA: reliable analysis of somatic structural variants and copy number aberrations using long-read sequencing

Affiliations

SAVANA: reliable analysis of somatic structural variants and copy number aberrations using long-read sequencing

Hillary Elrick et al. Nat Methods. 2025 Jul.

Abstract

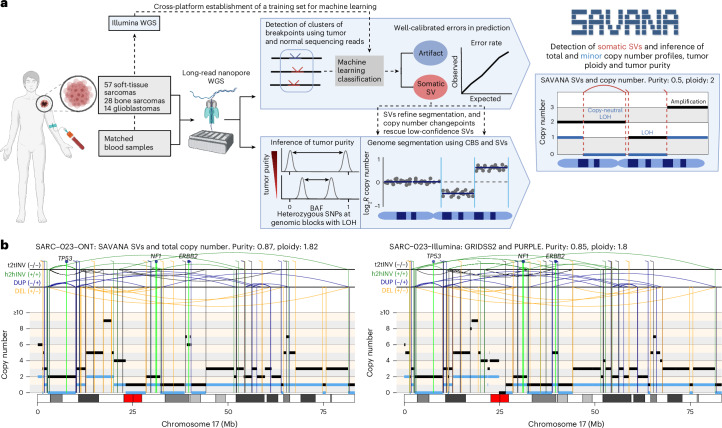
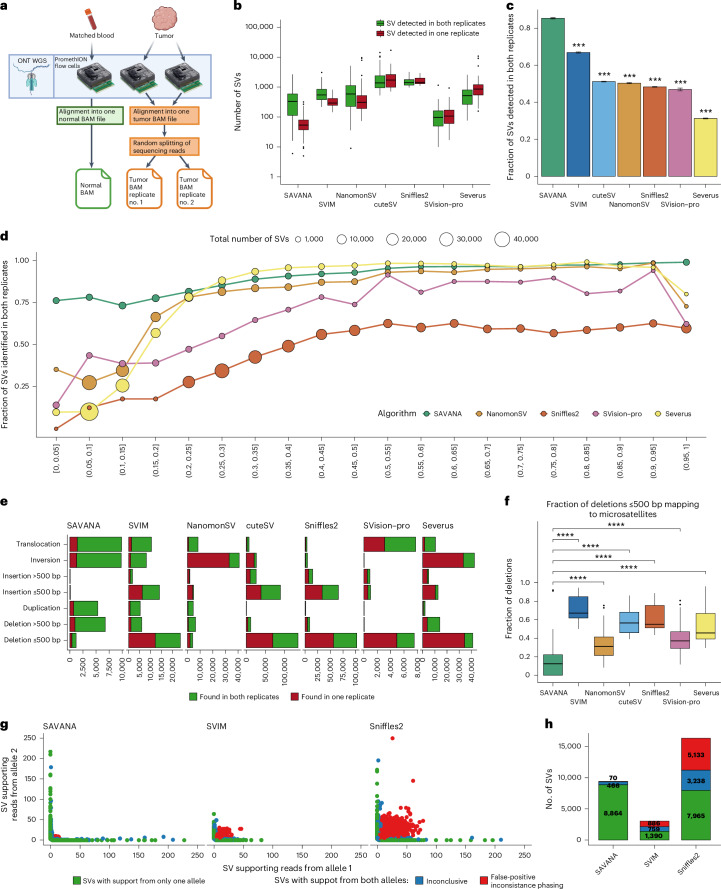
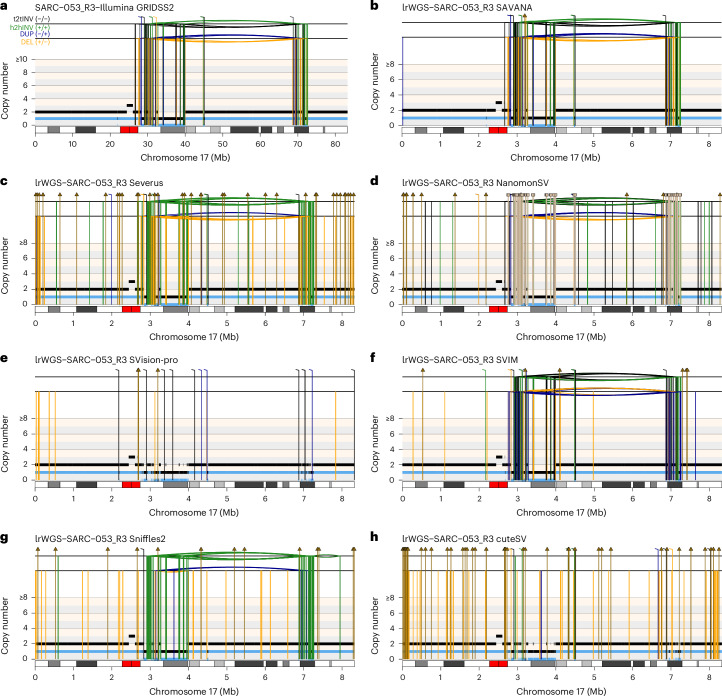
Accurate detection of somatic structural variants (SVs) and somatic copy number aberrations (SCNAs) is critical to study the mutational processes underpinning cancer evolution. Here we describe SAVANA, an algorithm designed to detect somatic SVs and SCNAs at single-haplotype resolution and estimate tumor purity and ploidy using long-read sequencing data with or without a germline control sample. We also establish best practices for benchmarking SV detection algorithms across the entire genome in a data-driven manner using replication and read-backed phasing analysis. Through the analysis of matched Illumina and nanopore whole-genome sequencing data for 99 human tumor-normal pairs, we show that SAVANA has significantly higher sensitivity and 13- and 82-times-higher specificity than the second and third-best performing algorithms. Moreover, SVs reported by SAVANA are highly consistent with those detected using short-read sequencing. In summary, SAVANA enables the application of long-read sequencing to detect SVs and SCNAs reliably.


Conflict of interest statement

Competing interests: H.E. and C.M.S. have received travel bursaries from ONT. The other authors declare no competing interests.

Figures

Fig. 1
Fig. 1. Overview of SAVANA.
a, The methodology for the analysis of somatic SVs, SCNAs, tumor purity and ploidy using SAVANA. Created with BioRender.com. b, An example of a complex genomic rearrangement profile detected using SAVANA and matched short-read sequencing data. The total and minor allele copy number data are represented in black and blue, respectively. DEL, deletion-like rearrangement; DUP, duplication-like rearrangement; h2hINV, head-to-head inversion; t2tINV, tail-to-tail inversion. CBS, circular binary segmentation; Mb, megabase pairs.
Fig. 2
Fig. 2. Benchmarking of SAVANA against existing algorithms using replicates.
a, A schematic representation of the replicate analysis strategy implemented to benchmark the performance of somatic SV detection algorithms. Created with BioRender.com. b, The distribution of the number of somatic SVs detected by each algorithm stratified based on whether they were detected in one (red) or both (green) replicates. Each point represents a tumor sample (n = 64) that has been split into two replicates. c, A comparison of the fraction of somatic SVs detected in both replicates by each algorithm. The bars report the result across all samples. The error bars report the 95% confidence interval. Significance with respect to SAVANA was assessed using the two-sided Student’s t-test (***P < 0.0001). The P values for SAVANA compared with all other algorithms were P < 2.2 × 10−16. d, The number of somatic SVs detected in both replicates divided by the total number of somatic SVs detected as a function of allele fraction. The results for the entire cohort are shown (n = 64). The size of the dots represents the number of somatic SVs in each group. Only algorithms that report the allele fraction or information that can be used to calculate the allele fraction were included in this analysis. e, A comparison of the count of somatic SVs detected in one (red) or both (green) replicates stratified by SV type. Note the different x-axis scales used to reflect the number of SVs reported by each algorithm. ce show the aggregated results for the 64 samples with the highest sequencing depth. f, The fraction of deletions in replicates mapping to microsatellite regions. Each point represents a tumor sample (n = 64) that has been split into two replicates. The significance was assessed using the two-sided Wilcoxon’s rank test (****P < 0.00001). The P values for the comparison between SAVANA against SVIM, NanomonSV, cuteSV, Sniffles2, SVision-pro and Severus were P < 2.2 × 10−16, P = 4.9 × 10−10, P < 2.2 × 10−16, P < 2.2 × 10−16, P = 5.1 × 10−13 and P < 2.2 × 10−16, respectively. g, A haplotype consistency analysis of SV-supporting reads using read-backed phasing across the entire cohort. Each dot represents an SV. The x and y axes report the number of sequencing reads supporting each SV that are assigned to either parental allele (arbitrarily labeled as ‘allele 1’ and ‘allele 2’, respectively). h, The same data shown in g depicted in a stacked barplot format. In g and h, the SVs supported by sequencing reads assigned to only one parental allele are colored in green. The SVs with significant read support from both parental alleles are shown in red, and those with inconclusive results are shown in blue. The box plots in b and f show the median, first and third quartiles (boxes) and the whiskers encompass observations within 1.5× the interquartile range from the first and third quartiles.
Fig. 3
Fig. 3. Benchmarking the specificity of SAVANA against existing algorithms using sequencing replicates of matched germline controls.
a, Schematic representation of the COLO829BL normal flow cell replicate analysis strategy implemented to quantify the false-positive rate of somatic SV detection algorithms. Created with BioRender.com. b, The number of somatic SVs detected in the COLO829BL cell line when running the algorithms benchmarked using a normal replicate as the tumor sample. The number on top of each bar indicates the number of false-positive calls for each algorithm. c, Schematic representation of the replicate analysis strategy implemented to quantify the false-positive rate of somatic SV detection algorithms. Created with BioRender.com. d, The distribution of false-positive SV calls detected when running the SV detection algorithms benchmarked using replicates of 37 whole-blood normal samples with at least 30× coverage, generated in silico by splitting sequencing reads randomly into two BAM files. Each dot represents one blood sample. The significance in d was assessed using the two-sided Wilcoxon’s rank test (****P < 0.0001). The P values for the comparison of SAVANA against cuteSV, Sniffles2, SVIM, Severus, SVision-pro and NanomonSV were P = 2.5 × 10−12, P = 2.5 × 10−12, P = 2.5 × 10−12, P = 2.5 × 10−12, P = 1.4 × 10−11 and P = 7 × 10−12, respectively. The box plots in d show the median, first and third quartiles (boxes), and the whiskers encompass observations within 1.5× the interquartile range from the first and third quartiles.
Fig. 4
Fig. 4. Benchmarking of SV detection algorithms.
a, The somatic SVs and copy number profiles detected using GRIDSS2 and PURPLE in whole-genome short-read sequencing data. bh,The somatic SVs were detected in matched long-read nanopore WGS data (lrWGS) using SAVANA (b), Severus (c), NanomonSV (d), SVision-pro (e), SVIM (f), Sniffles2 (g) and cuteSV (h). The copy number profiles shown in ah were calculated using PURPLE and the short-read sequencing data. The total and minor allele copy number data in ah are represented in black and blue, respectively. DEL, deletion-like rearrangement; DUP, duplication-like rearrangement; h2hINV, head-to-head inversion; t2tINV, tail-to-tail inversion. The lines with a square at the top represent single breakends, and the lines with arrowheads mark insertions.
Fig. 5
Fig. 5. Comparison between short and long-read data for the analysis of SVs and SCNAs.
a, The fraction of high-quality somatic SVs detected in Illumina WGS data using GRIDSS and PURPLE that are also detected in ONT data by the algorithms benchmarked. The fractions shown were computed by aggregating the somatic SV calls detected in all tumors in the cohort. Only samples with at least 30× tumor coverage in ONT WGS data were included (n = 83). b, Fraction of somatic SVs detected in ONT WGS data by each of the algorithms benchmarked that were also present in Illumina WGS data. c, Fraction of somatic SVs larger than 1,000 bp detected in ONT WGS data by each of the algorithms benchmarked that mapped within 500 bp of a somatic copy number changepoint detected in Illumina WGS data using PURPLE. The significance in ac was assessed using the two-sided Wilcoxon’s rank test (***P < 0.001). The P values for the comparison between SAVANA against all other algorithms were P < 2.2 × 10−16. df. Examples of somatic SV and SCNA profiles of increasing complexity detected in long-read nanopore WGS data using SAVANA (left) and in Illumina WGS data using GRIDSS2 and PURPLE (right) for tumors SARC-051 (d), SARC-015 (e) and SARC-012 (f). The total and minor allele copy number data are represented in black and blue, respectively. DEL, deletion-like rearrangement; DUP, duplication-like rearrangement; h2hINV, head-to-head inversion; t2tINV, tail-to-tail inversion. The lines with arrowheads mark insertions.
Fig. 6
Fig. 6. Comparison of the tumor purity and ploidy estimates computed using different SAVANA modes and ONT WGS data against PURPLE and Illumina WGS data.
a, Tumor purity estimates. b, Tumor ploidy estimates. Panels labelled as ‘SAVANA-paired germline SNPs’ show results for matched tumor-normal pair analysis using matched normal germline SNPs for purity estimation. Panels labelled as ‘SAVANA-paired 1000 G SNPs’ show results for matched tumor-normal pair analysis using the 1000 Genome Project population SNPs with allele fractions >0.25 and allele fractions <0.75. Panels labelled as ‘The SAVANA tumor-only 1000 G SNPs’ show results for analysis using the 1000 Genome Project population SNPs with allele fractions >0.25 and allele fractions <0.75. For this analysis, we only considered the 44 tumors with region-matched nanopore and Illumina WGS data. ***P < 0.0001. The P values for tumor purity comparisons shown in a were P < 2.2 × 10−16, P = 3 × 10−16, P < 2.2 × 10−16, P < 2.2 × 10−16, P = 1.1 × 10−13 and P = 1.5 × 10−14, respectively. The P values for tumor ploidy comparisons depicted in b were P < 2.2 × 10−16, P < 2.2 × 10−16, P = 2.6 × 10−16, P < 2.2 × 10−16, P = 1.1 × 10−13 and P < = 1.9 × 10−12, respectively (reading from top to bottom, left to right).

Similar articles

Cited by

  • Comprehensive genomic characterization of early-stage bladder cancer.
    Prip F, Lamy P, Lindskrog SV, Strandgaard T, Nordentoft I, Birkenkamp-Demtröder K, Birkbak NJ, Kristjánsdóttir N, Kjær A, Andreasen TG, Ahrenfeldt J, Pedersen JS, Rasmussen AM, Hermann GG, Mogensen K, Petersen AC, Hartmann A, Grimm MO, Horstmann M, Nawroth R, Segersten U, Sikic D, van Kessel KEM, Zwarthoff EC, Maurer T, Simic T, Malmström PU, Malats N, Jensen JB; UROMOL Consortium; Real FX, Dyrskjøt L. Prip F, et al. Nat Genet. 2025 Jan;57(1):115-125. doi: 10.1038/s41588-024-02030-z. Epub 2025 Jan 3. Nat Genet. 2025. PMID: 39753772 Free PMC article.
  • Genome-wide association testing beyond SNPs.
    Harris L, McDonagh EM, Zhang X, Fawcett K, Foreman A, Daneck P, Sergouniotis PI, Parkinson H, Mazzarotto F, Inouye M, Hollox EJ, Birney E, Fitzgerald T. Harris L, et al. Nat Rev Genet. 2025 Mar;26(3):156-170. doi: 10.1038/s41576-024-00778-y. Epub 2024 Oct 7. Nat Rev Genet. 2025. PMID: 39375560 Free PMC article. Review.

References

    1. The ICGC/TCGA Pan-Cancer Analysis of Whole Genomes Consortium. Pan-cancer analysis of whole genomes. Nature578, 82–93 (2020).
    1. Cortés-Ciriano, I. et al. Comprehensive analysis of chromothripsis in 2,658 human cancers using whole-genome sequencing. Nat. Genet.52, 331–341 (2020). - PMC - PubMed
    1. Hadi, K. et al. Distinct classes of complex structural variation uncovered across thousands of cancer genome graphs. Cell183, 197–210.e32 (2020). - PMC - PubMed
    1. Li, Y. et al. Patterns of somatic structural variation in human cancer genomes. Nature578, 112–121 (2020). - PMC - PubMed
    1. Cortés-Ciriano, I., Gulhan, D. C., Lee, J. J.-K., Melloni, G. E. M. & Park, P. J. Computational analysis of cancer genome sequencing data. Nat. Rev. Genet.23, 298–314 (2021). - PubMed

MeSH terms

LinkOut - more resources