. 2025 May 14:16:1576766.
doi: 10.3389/fimmu.2025.1576766. eCollection 2025.

Compensatory mechanisms in γδ T cell-deficient chickens following Salmonella infection

Affiliations

Compensatory mechanisms in γδ T cell-deficient chickens following Salmonella infection

Felix Tetzlaff et al. Front Immunol. .

Abstract

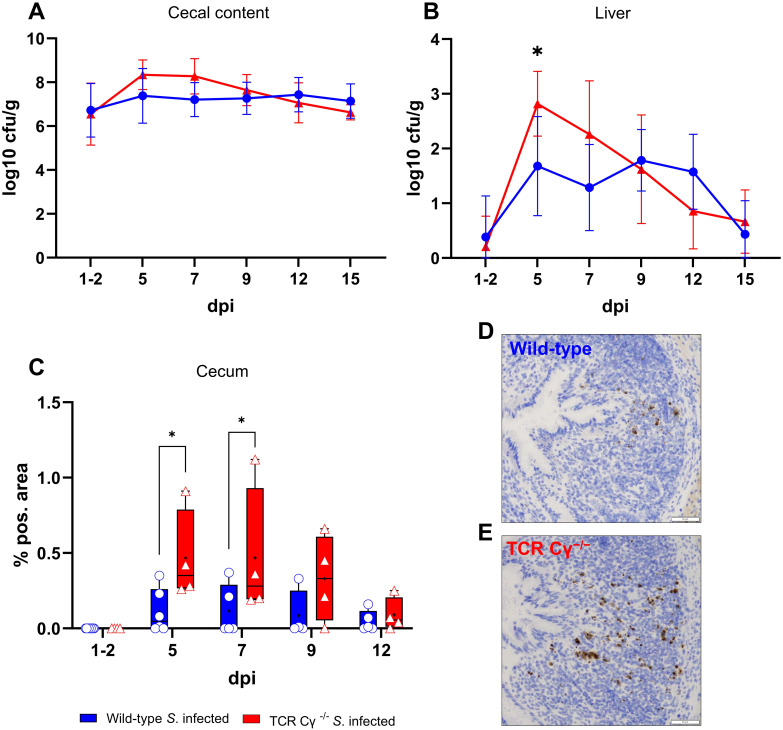
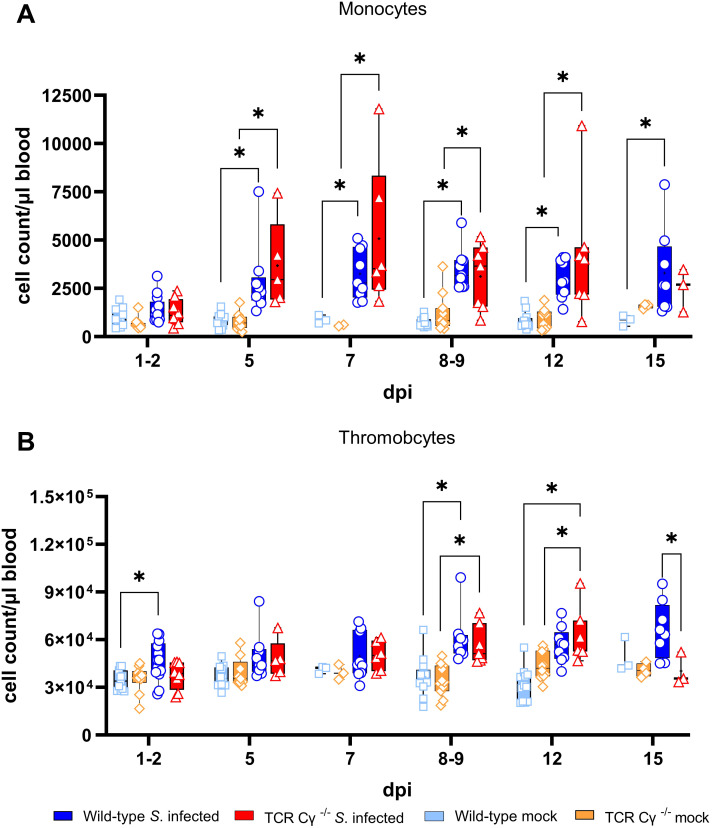
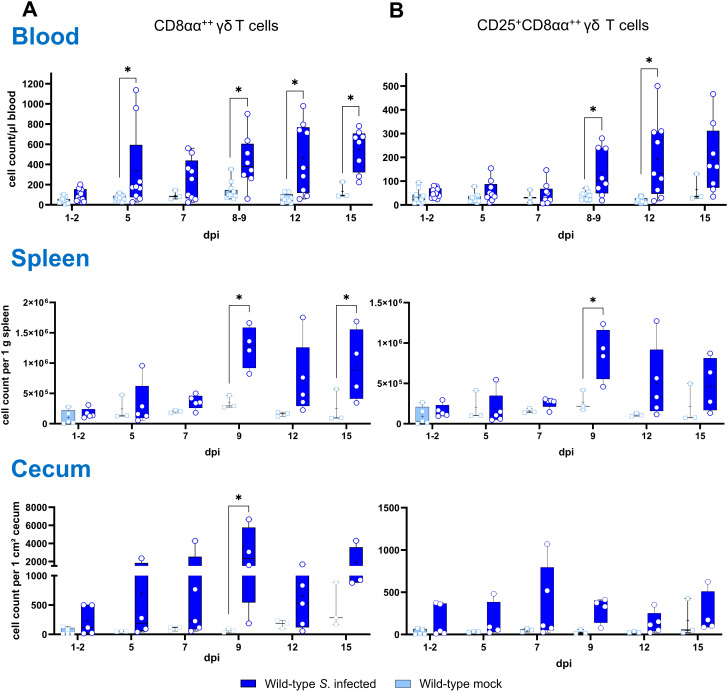
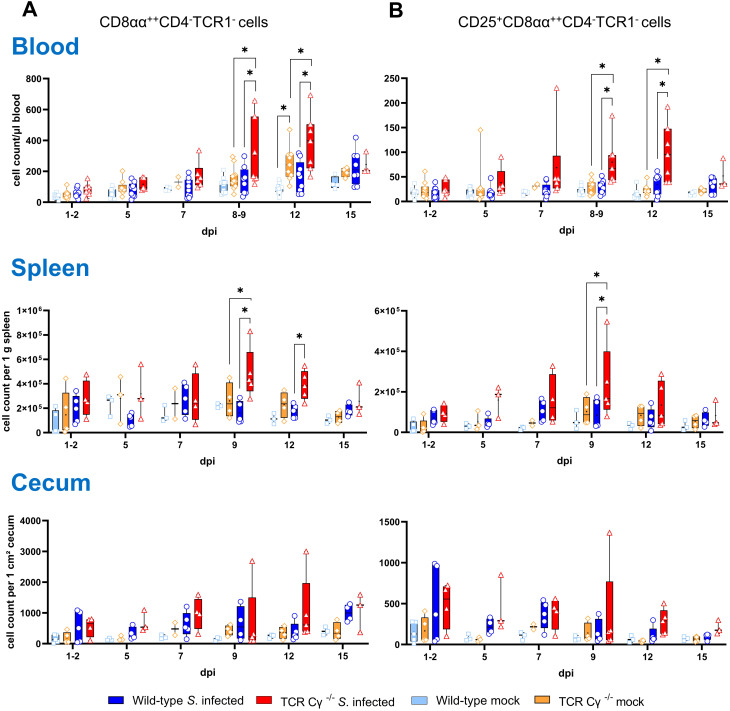
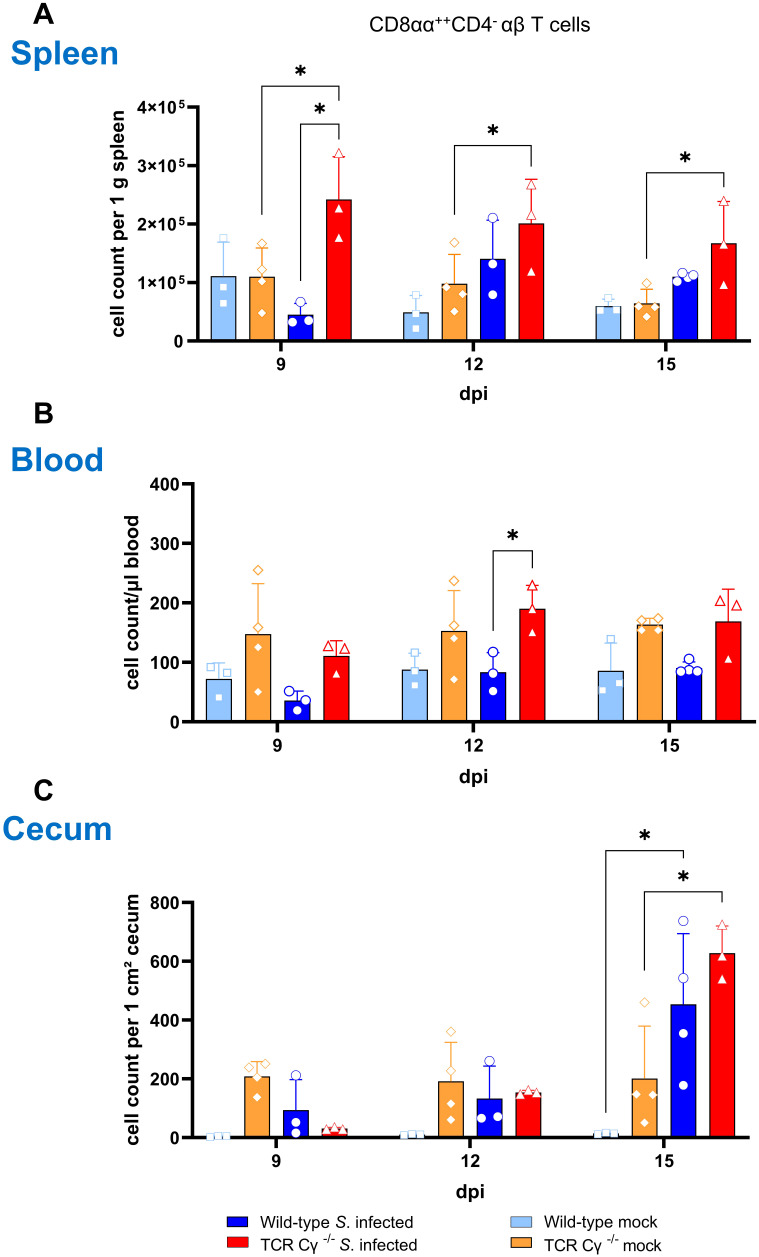
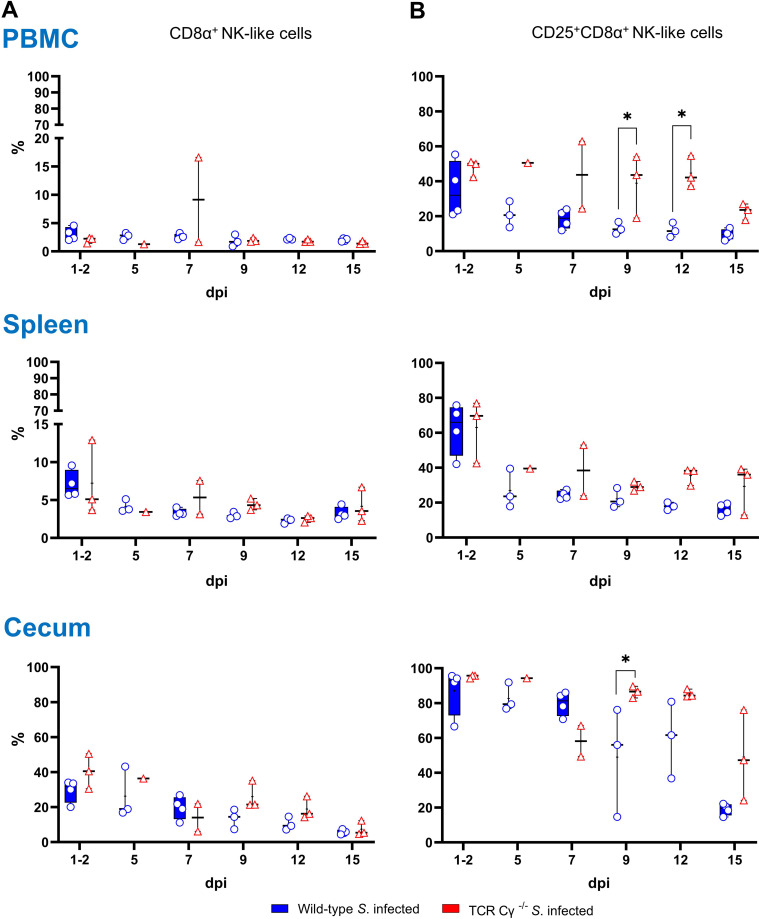
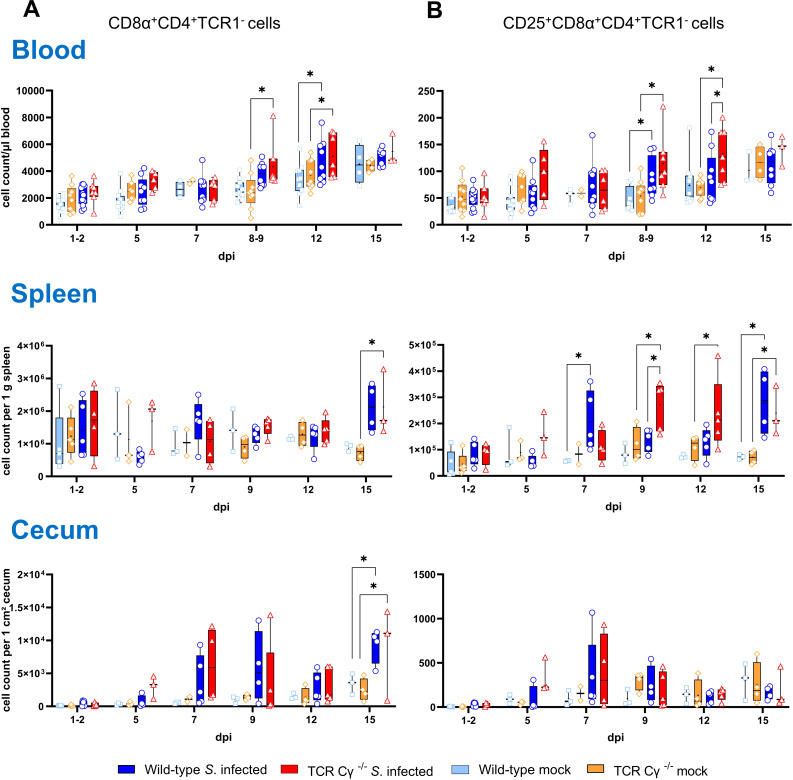
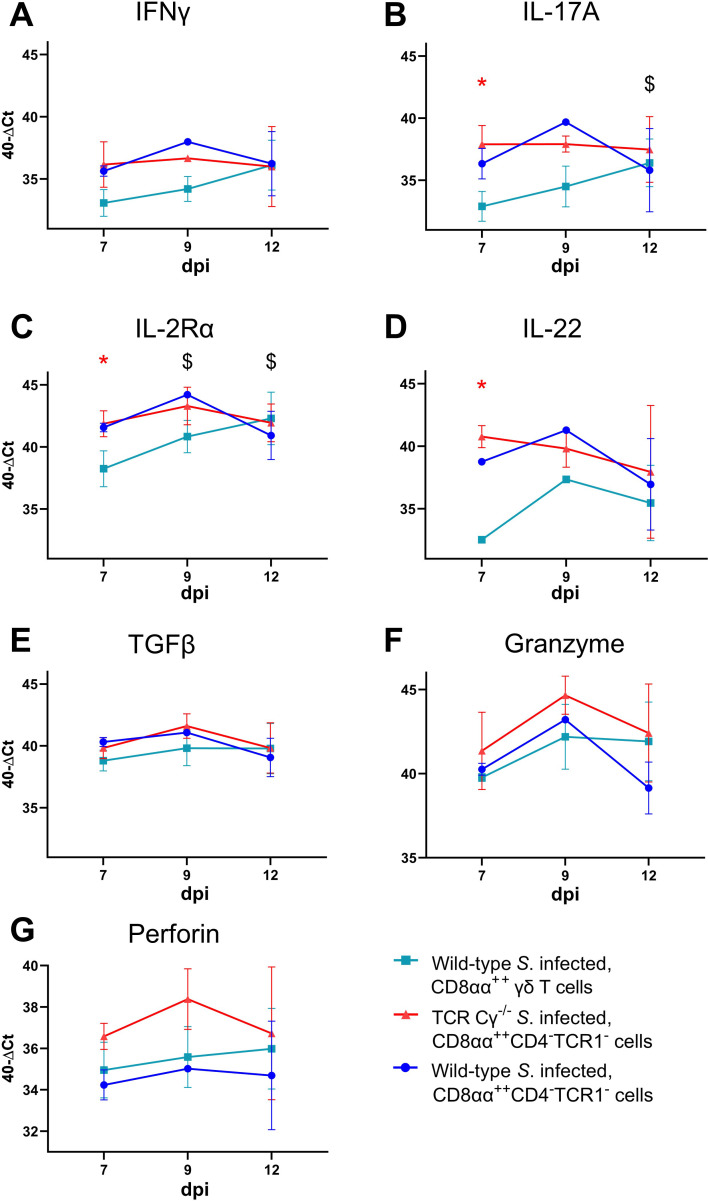
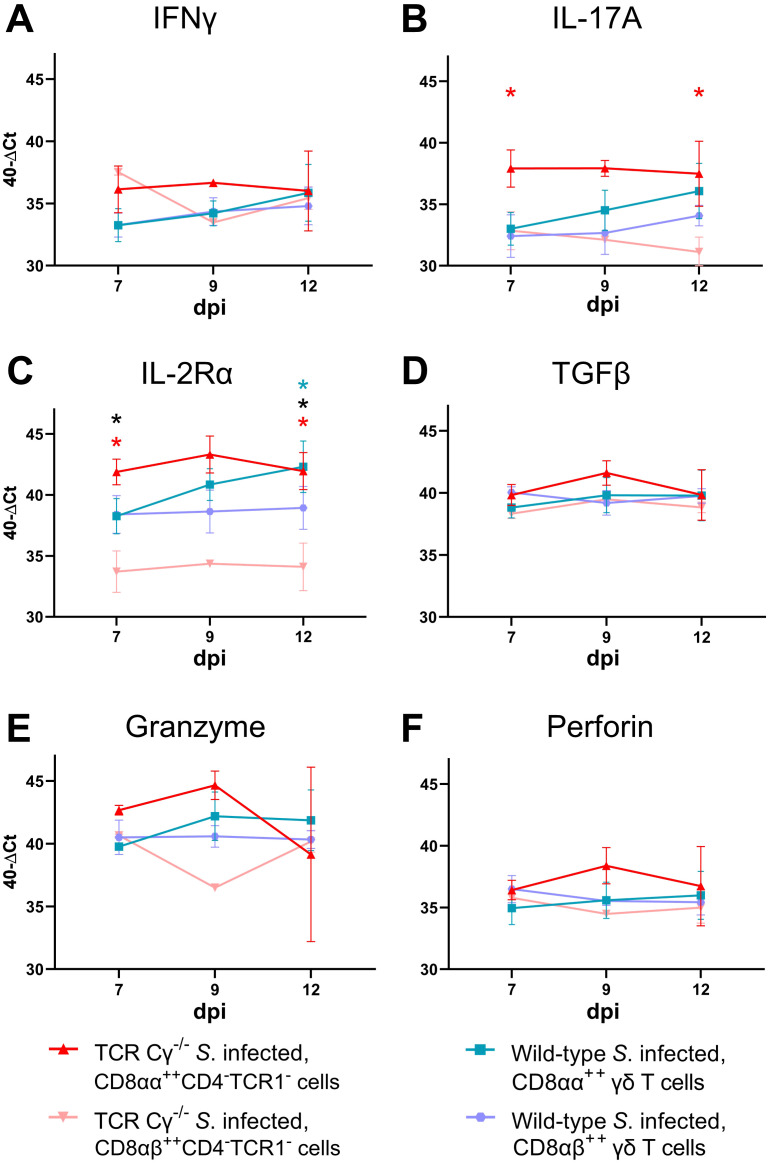
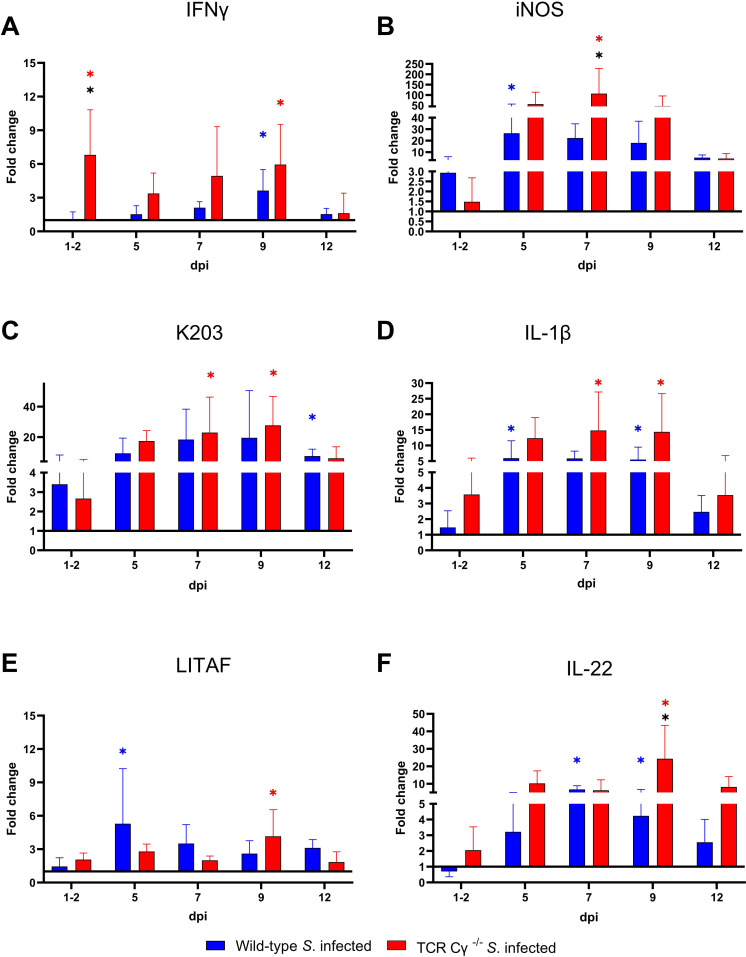
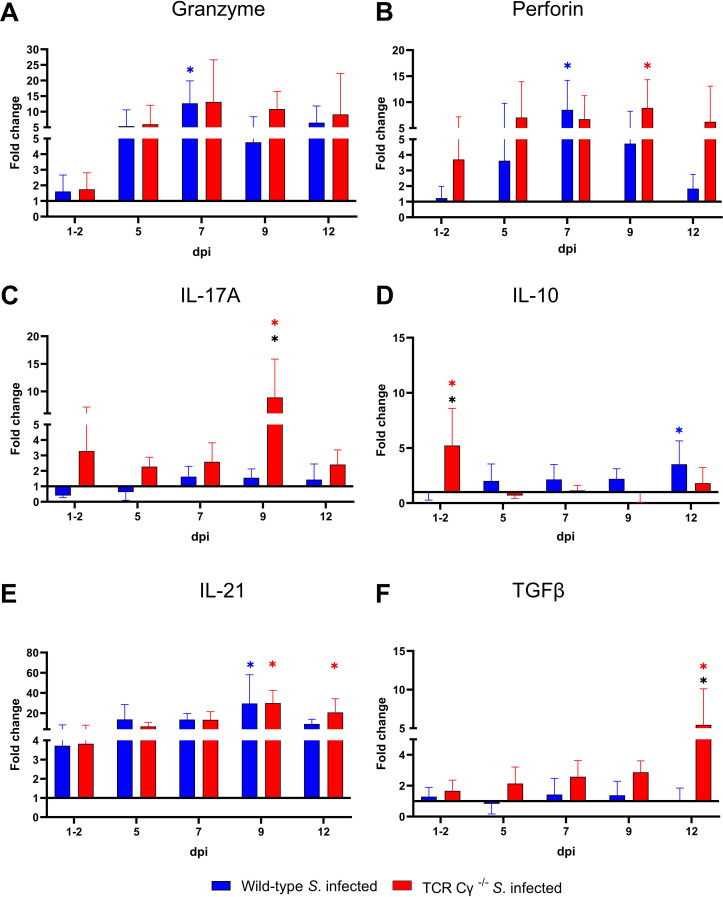
Avian γδ T lymphocytes are highly abundant in the intestinal mucosa and play a critical role in immune defense against infectious diseases in chickens. However, their specific contributions to infection control remain poorly understood. To investigate the role of γδ T cells and their possible compensation, we studied wild-type and γδ T cell knockout chickens following infection with Salmonella Enteritidis. Bacterial loads in the liver, cecal content, and cecal wall were quantified. Immune cell populations in blood, spleen, and cecum were analyzed using flow cytometry. Immune gene transcription in sorted γδ (TCR1+) and TCR1- cell subsets as well as cecal tissue was measured by RT-qPCR. Strikingly, chickens lacking γδ T cells had significantly higher bacterial loads in the liver and more extensive Salmonella invasion in the cecal wall during the early stages of infection compared to wild-type birds. In blood, infected γδ T cell knockout chickens displayed a significantly increased percentage of CD25+ NK-like cells. In both blood and tissue, infected wild-type chickens demonstrated an increased absolute number of CD8αα+hi γδ T cells (CD4-). Conversely, γδ T cell knockout chickens exhibited an augmented cell count of a CD8αα+hiCD4-TCR1- cell population after infection, which might include αβ T cells. At 7 days post infection (dpi), gene expression analysis revealed elevated transcription of the activation marker IL-2Rα and proinflammatory cytokines (IL-17A, IFN-γ) in CD8αα+hiCD4-TCR1- cells from γδ T cell knockout chickens compared to CD8αα+hi γδ T cells from wild-type birds. By 12 dpi, these differences diminished as transcription levels increased in γδ T cells of wild-type animals. Our findings demonstrate that γδ T cells play a role in early immune protection against Salmonella Enteritidis infection in chickens. In later stages of the infection, the γδ T cells and their functions appear to be replaced by other cells.

Keywords: CD8α T cells; Salmonella; chickens; compensation; knockout; γδ T cells.


Conflict of interest statement

The authors declare that the research was conducted in the absence of any commercial or financial relationships that could be construed as a potential conflict of interest. The author(s) declared that they were an editorial board member of Frontiers, at the time of submission. This had no impact on the peer review process and the final decision.

Figures

Figure 1
Figure 1
Detection of Salmonella Enteritidis in wild-type and TCR Cγ−/− chickens post infection. Logarithmic bacterial counts of Salmonella in cecal content (A) and liver (B) of wild-type and TCR Cγ−/− chickens (infection on day 3 of age). Data represent the mean ± standard deviation; n = 3-9. The box plot diagram displays the percentage of Salmonella-positive area in cecal mucosa (C) of infected wild-type and TCR Cγ−/− chickens. Data are presented as minimum and maximum cell counts, with median indicated; n = 4-8. Representative immunohistochemical staining of Salmonella (brown) in cecal tissue from infected wild-type (D) and TCR Cγ−/− chickens (E) at 5 dpi. Scale bar indicates 50 µm. * indicates significant differences between chicken groups, p< 0.05 (2-way ANOVA-Tukey’s multiple comparison test).
Figure 2
Figure 2
Flow cytometric analysis of leukocytes in avian whole blood following Salmonella Enteritidis infection. Absolute numbers of viable monocytes (A) and thrombocytes (B) were measured over time in blood from wild-type and TCR Cγ−/− chickens following Salmonella or mock infection on day 3 of age. Data are presented as minimum and maximum cell counts, with median indicated; n = 2-13. * indicates significant differences between chicken groups, p< 0.05 (2-way ANOVA-Tukey’s multiple comparison test).
Figure 3
Figure 3
Flow cytometric analysis of γδ T cell subsets in wild-type chickens after Salmonella Enteritidis infection. Absolute numbers of CD8αα+hi (A) and CD25+CD8αα+hi (B) γδ T cells (TCR1+) are shown of blood (n = 3-13), spleen (n = 3-5) and cecum (n = 3-5) from Salmonella-infected and mock-infected wild-type chickens (infection on day 3 of age). Data are presented as minimum and maximum cell counts, with median indicated. * indicates significant differences between chicken groups, p< 0.05 (2-way ANOVA-Tukey’s multiple comparison test; cecum: Mann–Whitney U test).
Figure 4
Figure 4
Flow cytometric analysis of TCR1- cell subsets in wild-type and TCR Cγ−/− chickens after Salmonella Enteritidis infection. Absolute numbers of CD8αα+hiCD4-TCR1- (A) and CD25+CD8αα+hiCD4-TCR1- cells (B) are shown for blood (n = 2-13), spleen (n = 2-5) and cecum (n = 2-5) from Salmonella-infected and mock-infected wild-type and TCR Cγ−/− chickens (infection on day 3 of age). Data are presented as minimum and maximum cell counts, with median indicated. * indicates significant differences between chicken groups, p< 0.05 (2-way ANOVA-Tukey’s multiple comparison test).
Figure 5
Figure 5
Emergence of CD8αα+hiCD4- αβ T cells in TCR Cγ−/− chickens following Salmonella Enteritidis infection. Absolute numbers of CD8αα+hiCD4- Vβ1/Vβ2 αβ T cell subsets (TCR2/TCR3+) are shown for spleen (A), blood (B) and cecum (C) of Salmonella-infected and mock-infected wild-type and TCR Cγ−/− chickens (infection on day 3 of age). Data represent the mean ± standard deviation; n = 3-4. * indicates significant differences between chicken groups, p< 0.05 (2-way ANOVA-Tukey’s multiple comparison test).
Figure 6
Figure 6
Frequency and activation status (CD25 expression) of NK-like cells in wild-type and TCR Cγ−/− chickens after Salmonella Enteritidis infection. (A) Relative frequency of CD8α+ NK-like cells within the CD45+ lymphocyte population lacking T and B cell lineage as well as monocyte markers (TCR1, TCR2, TCR3, CD4, Bu1, K1) in PBMCs, spleen and cecum of Salmonella-infected wild-type and TCR Cγ−/− chickens (infection on day 3 of age). (B) Percentage of CD8α+ NK-like cells expressing CD25 (marker of cell activation) relative to all CD8α+ NK-like cells. Data are presented as minimum and maximum cell counts, with median indicated; n = 1-4. * indicates significant differences between chicken groups, p< 0.05 (2-way ANOVA-Tukey’s multiple comparison test).
Figure 7
Figure 7
Flow cytometric analysis of CD8α+CD4+ T cells in Salmonella Enteritidis infected chickens. Absolute numbers of CD8α+CD4+TCR1- (A) and CD25+CD8α+CD4+TCR1- cells (B) are shown for blood (n = 2-13), spleen (n = 2-5), and cecum (n = 2-5) from wild-type and TCR Cγ−/− chickens following Salmonella and mock infection on day 3 of age. Data are presented as minimum and maximum cell counts, with median indicated. * indicates significant differences between chicken groups, p< 0.05 (2-way ANOVA-Tukey’s multiple comparison test).
Figure 8
Figure 8
RT qPCR analysis of sorted CD8αα+hi γδ and TCR1- cells from Salmonella Enteritidis-infected wild-type and TCR Cγ−/− chickens. Transcription levels of IFN-γ, IL-17A, IL-2Rα, IL-22, TGFβ, granzyme, and perforin (A-G) were measured in CD8αα+hi γδ (n = 4-6; IL-22: n7dpi = 3; n9dpi = 1; n12dpi = 6) and CD8αα+hiCD4-TCR1- cells (n7dpi = 2; n9dpi = 1; n12dpi = 6) from wild-type chickens, as well as CD8αα+hiCD4-TCR1- cells (n7dpi = 3¸ n9dpi = 2; n12dpi = 3-4) from TCR Cγ−/− animals. Data represent the mean 40-ΔCt ± standard deviation. * indicates significant difference between CD8αα+hi γδ T cells of wild-type chickens and CD8αα+hiCD4-TCR1- cells of TCR Cγ−/− birds. $ indicates significant different transcription levels of CD8αα+hi γδ T cells compared to 7 dpi, p< 0.05 (2-way ANOVA-Tukey’s multiple comparison test).
Figure 9
Figure 9
RT qPCR analysis of sorted CD8αα+hi and CD8αβ+hi T cell subsets from Salmonella Enteritidis-infected wild-type and TCR Cγ−/− chickens. Transcription levels of IFN-γ, IL-17A, IL-2Rα, TGFβ, granzyme, and perforin (A-F) were measured in CD8αα+hi (n = 4-6) and CD8αβ+hi γδ T cells (n = 4-6) from wild-type chickens, as well as CD8αα+hiCD4-TCR1- (n7dpi = 3¸ n9dpi = 2; n12dpi = 3-4) and CD8αβ+hiCD4-TCR1- cells (n7dpi = 3¸ n9dpi = 1; n12dpi = 4) from TCR Cγ−/− animals. Data represent the mean 40-ΔCt ± standard deviation. * indicates significant difference between CD8αα+hiCD4-TCR1- and CD8αβ+hiCD4-TCR1- cells of TCR Cγ−/− animals. * indicates significant difference between CD8αα+hi and CD8αβ+hi γδ T cells of wild-type animals. * indicates a significant difference between CD8αβ+hiCD4-TCR1-cells from TCR Cγ−/− animals and CD8αβ+hi γδ T cells from wild-type birds, p< 0.05 (2-way ANOVA-Tukey’s multiple comparison test).
Figure 10
Figure 10
RT qPCR analysis of pro-inflammatory genes in cecal tissue of wild-type and TCR Cγ−/− chickens following Salmonella Enteritidis infection. Fold change expression levels of IFN-γ, iNOS, K203, IL-1β, LITAF, and IL-22 (A-F) in Salmonella-infected wild-type and TCR Cγ−/− chickens relative to their respective mock-infected controls. Data represent the means ± standard deviation; n = 6-9 (infected wild-type), n = 3-4 (infected TCR Cγ−/−, wild-type control and TCR Cγ−/− control). * indicates significant difference between Salmonella-infected wild-type and TCR Cγ−/− chickens. */* indicate a significant difference between Salmonella-infected birds to their respective mock-infected controls, p< 0.05 (2-way ANOVA-Tukey’s multiple comparison test).
Figure 11
Figure 11
RT qPCR of immune related genes in cecal tissue of wild-type and TCR Cγ−/− chickens following Salmonella Enteritidis infection. Fold change expression levels of granzyme, perforin, IL-17A, IL-10, IL-21, and TGFβ (A-F) in Salmonella-infected wild-type and TCR Cγ−/− chickens relative to their respective mock-infected controls. Data represent the means ± standard deviation; n = 6-9 (infected wild-type), n = 3-4 (infected TCR Cγ−/−, wild-type control and TCR Cγ−/− control). * indicates a significant difference between Salmonella-infected wild-type and TCR Cγ−/− chickens. */* indicate a significant difference between Salmonella-infected birds to their respective mock-infected controls, p< 0.05 (2-way ANOVA-Tukey’s multiple comparison test).

Similar articles

References

    1. EFSA EFSA. EFSA EFSA. ECDC ECDPC . The european union one health 2022 zoonoses report. Efsa J. (2023) 21:31–64. doi: 10.2903/j.efsa.2023.8442 - DOI - PMC - PubMed
    1. Barrow PA, Huggins MB, Lovell MA, Simpson JM. Observations on the pathogenesis of experimental Salmonella typhimurium infection in chickens. Res Vet Sci. (1987) 42:194–9. doi: 10.1016/S0034-5288(18)30685-4 - DOI - PubMed
    1. Beal RK, Powers C, Wigley P, Barrow PA, Kaiser P, Smith AL. A strong antigen-specific T-cell response is associated with age and genetically dependent resistance to avian enteric salmonellosis. Infect Immun. (2005) 73:7509–16. doi: 10.1128/IAI.73.11.7509-7516.2005 - DOI - PMC - PubMed
    1. Beal RK, Wigley P, Powers C, Hulme SD, Barrow PA, Smith AL. Age at primary infection withserovar Typhimurium in the chicken influences persistence of infection and subsequent immunity to re-challenge. Vet Immunol Immunop. (. 2004) 100:151–64. doi: 10.1016/j.vetimm.2004.04.005 - DOI - PubMed
    1. Tanikawa T, Shoji N, Sonohara N, Saito S, Shimura Y, Fukushima J, et al. . Aging transition of the bacterial community structure in the chick ceca. Poult Sci. (2011) 90:1004–8. doi: 10.3382/ps.2010-01153 - DOI - PubMed

MeSH terms

Substances

LinkOut - more resources