Review
. 2025 Jan;12(Suppl 1):S14611.
doi: 10.1117/1.NPh.12.S1.S14611. Epub 2025 May 28.

Review of cocaine-induced brain vascular and cellular function changes measured in vivo with optical imaging

Affiliations
Review

Review of cocaine-induced brain vascular and cellular function changes measured in vivo with optical imaging

Congwu Du et al. Neurophotonics. 2025 Jan.

Abstract

Significance: Cocaine exerts effects on vascular and cellular functions in the brain. The interactions among cerebrovasculature, neurons, and astrocytes and their dynamic changes during exposure complicate the understanding of its effects. Therefore, there is a need for simultaneous, multiparameter in vivo measurements to accurately distinguish these effects.

Aim: A multimodal optical imaging approach that is tailored to investigate cocaine's effects on cerebrovasculature, neurons, and astrocytes in high-spatiotemporal resolution and large field of view is presented with comparisons to other modalities.

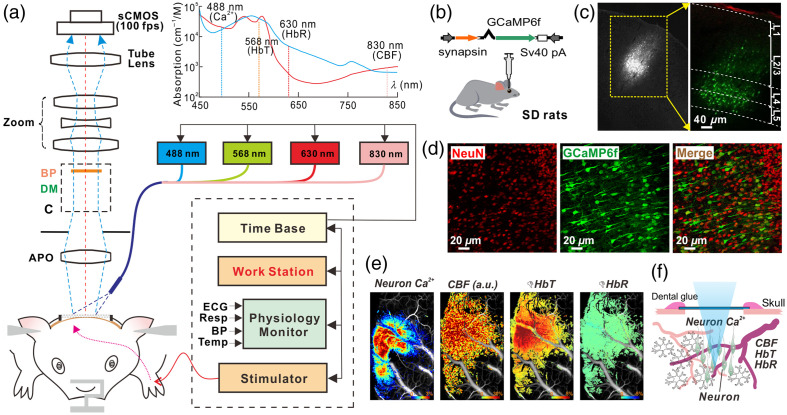
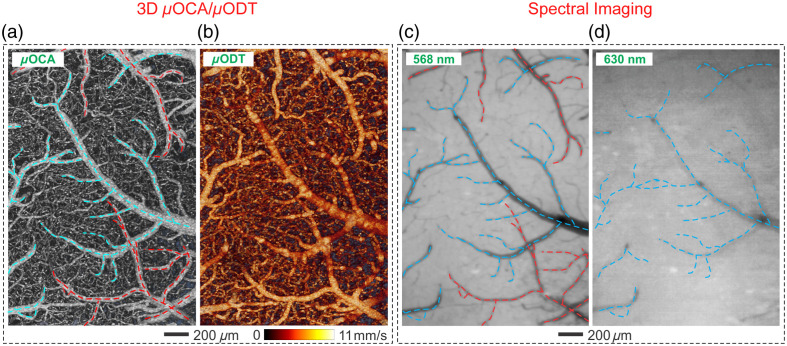
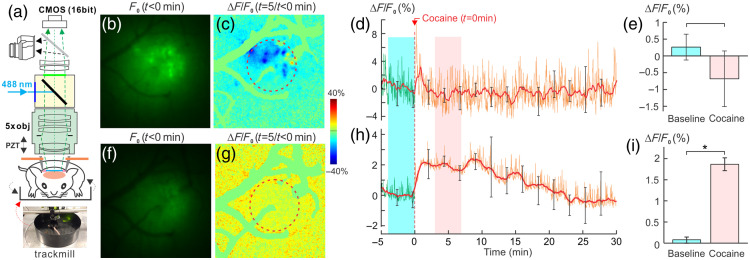
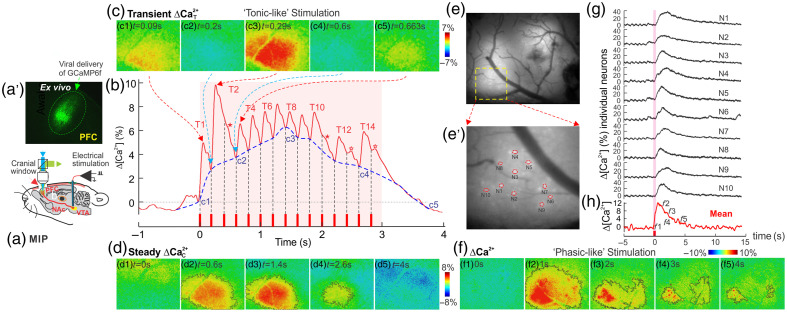
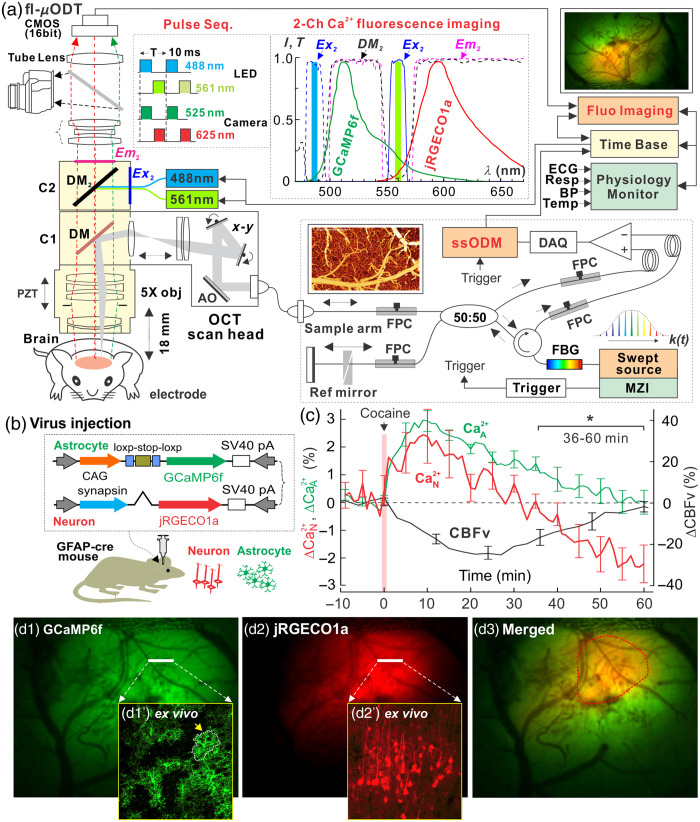
Approach: This approach integrates optical coherence tomography, fluorescence, and spectral absorption imaging to permit high-resolution imaging of 3D cerebrovessels, cerebral blood flow (CBF), changes in oxygenated/deoxygenated hemoglobin, and large-scale cellular activities via intracellular calcium fluorescence expressed through genetically encoded calcium indicators in the mouse cortex.

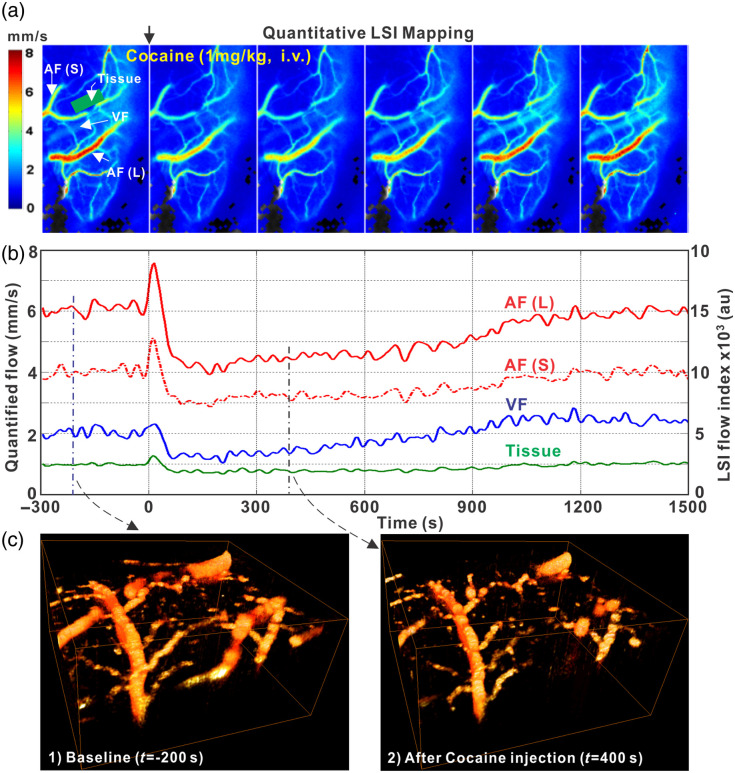
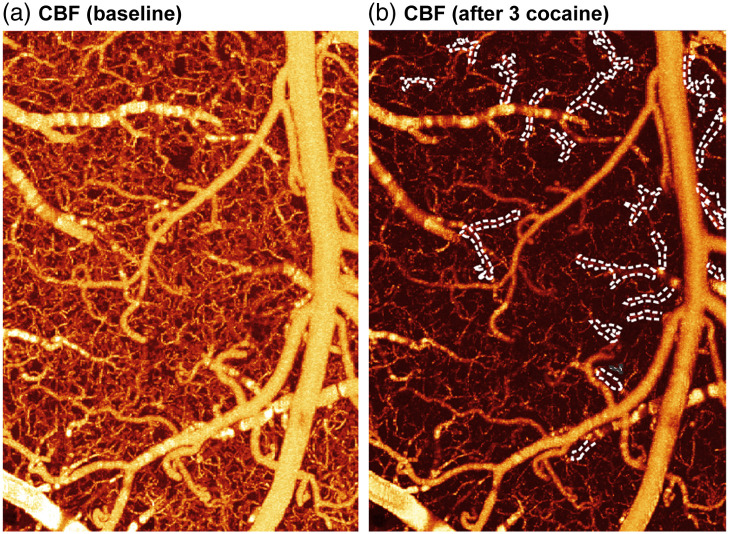
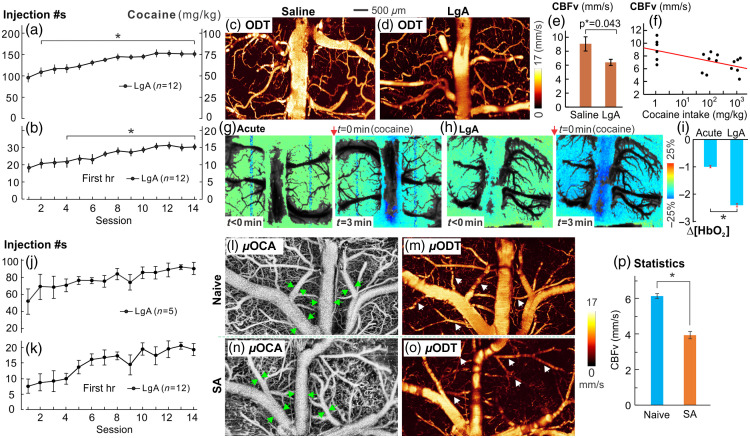
Results: Results show that cocaine induces vasoconstriction and reduces CBF, thus increasing the susceptibility of the brain to ischemia with chronic exposure. Moreover, cocaine alters neuronal activity and frontal responses to deep brain stimulation.

Conclusions: These findings on cocaine's effects on the neuro-astroglial-vascular network in the prefrontal cortex highlight the unique capacity of optical imaging to reveal the cellular and vascular mechanisms underlying cocaine's neurotoxic effects on brain function.

Keywords: addiction; cerebral blood flow; cocaine; hemoglobin oxygenation and deoxygenation; neuroimaging; optical imaging in vivo.


Figures

Fig. 1
Fig. 1
(a) Schematic illustrating the principle of our multimodality imaging platform (MIP) that integrates Ca2+ fluorescence imaging (λEX1=488  nm) with a multiwavelength imager (MWI, λ2=568  nm, and λ3=630  nm) and laser speckle contrast imaging (LSCI, λ4=830  nm). This system enables simultaneous detection of neuronal Ca2+ activity with cerebral metabolic and hemodynamic changes. Sensory stimulation, such as electrical forepaw stimulation, is synchronized with the imaging platform through a shared time base, ensuring precise temporal alignment. (b) Viral injection to express a genetically encoded calcium indicator, GCaMP6f, to neurons in the somatosensory cortex. (c) Ex vivo fluorescence images to show the GCaMP6f distributions in cortical layers IV–V in the somatosensory cortex. (d) Confirmation via double staining with NeuN antibody that labels neurons and GFP antibody that labels GCaMP6f to show that all the GFP+ cells were neurons. (e) Simultaneous imaging of neuronal Ca2+N, CBF, HbT, and HbR responses to forepaw electrical stimulation (image size: 3×5  mm2). (f) Schematic representation of simultaneous imaging of synchronized neuronal Ca2+ dynamics within a neuronal population and the corresponding local hemodynamic responses. (Updated from Chen et al.51)
Fig. 2
Fig. 2
Multimodal imaging platform with μOCT for imaging cortical vascular networkin vivo. (a) Ultra-high resolution optical coherence angiography (μOCA) of the vascular network from a mouse cortex in vivo. (b) Its quantitative map of CBF velocity obtained using ultra-high resolution optical coherence Doppler tomography (μODT) at a wavelength of λ1=1300  nm. (c), (d) Spectral images of the cortex at λ2=568  nm and λ3=630  nm, highlighting arteries (indicated by red arrows) and veins (indicated by blue arrows). Modified from Du et al.
Fig. 3
Fig. 3
Spatiotemporal dynamics of CBF in the rat cortex in response to cocaine i.v. injection under isoflurane anesthesia using laser speckle contrast imaging (LSCI) and Doppler optical coherence tomography (DRF-OCT). (a) Time course of quantitative flow mapping obtained from LSCI. (b) Cocaine-evoked CBF change from selected larger and small arteriole flows, AF(L) and AF(S), a venule (VF), and an avascular flow or tissue perfusion (tissue) in the ROI by simultaneous imaging of LSCI and DRF-OCT. (c) A pair of 3D DRF-OCT to illustrate vascular constriction after cocaine injection.
Fig. 4
Fig. 4
Observation of cocaine-induced micro-ischemia from a mouse cortex. (a) μODT image shows the cortical blood flow at baseline. (b) μODT image after three sequential cocaine administrations, white-dashed traces show the occluded vessels after three cocaine administrations.
Fig. 5
Fig. 5
Cocaine self-administration (SA) by rats (a), (b) and by mice (j), (k), indicating the escalation period of cocaine intake. LgA: cocaine infusions in 6 h session. (c)–(i) Image comparison between the rat control group with saline and cocaine SA rats for assessing the effects of LgA cocaine SA on the prefrontal cortex (PFC). (c), (d) Representative images of the rat control and LgA groups showing their quantitative CBF velocity in the PFC, respectively. The LgA animal exhibited a global CBF velocity decrease. (e) Significant CBF velocity decreases in vessels between control (n=6) and LgA (n=6) rats. (f) Correlation between CBF velocity and doses of cocaine intake (in log10 scale), indicating an inverse association between CBF velocity and the amount of cocaine administered by the animals. (g) Representative full-field [HbO2] map of the PFC before and 3 min after acute cocaine (1  mg/kg, i.v.) in a cocaine-naïve (i.e., control) and in a LgA rat in panel (h), indicating a global decrease in Δ[HbO2] of the LgA cocaine animal (represented by the blue area in the PFC image at t=3  min). (i) Comparison of the total decrease of [HbO2] over the recording period (t=30  min) in response to acute cocaine (1  mg/kg, i.v., during imaging) between the control and LgA rats, showing significant [HbO2] decreases in LgA cocaine animal brain (p=0.02). (Updated from Du et al.59). (j)–(p) Mouse model of LgA SA (n=5) to compare with its controls (saline infusion, n=5). (l), (n) 3D μOCA for microvasculature in control and SA mice, indicating cocaine-induced vasoconstriction in the PFC of SA mouse (green arrows); (m), (o) μODT for quantitative CBF in control and SA mice, indicating a global CBF decrease in the PFC of SA mouse. (p) Statistical comparison of CBF in vessels (white arrows between controls (n=5) and SA (n=5) mice.
Fig. 6
Fig. 6
(a) MIP with air-floating mobile cage to image cocaine-induced neuronal Ca2+N changes in the awake (b)–(e) and anesthetized states (f)–(i). (b), (f) Ca2+ fluorescence images in awake- and isoflurane-anesthetized-states, respectively. (c), (g) The ratio images before and after cocaine in the awake- (c) and isoflurane-anesthetized states (g). (d), (h) Time-lapse ΔCa2+N (%) in the awake- (d) and anesthetized states (h). (e)–(i) Mean Ca2+N differences between baseline (t=5 to 0 min) and after cocaine (t=3 to 8 min), showing that the mean Ca2+N fluorescence was not significantly changed in the awake state [F(14,28)=1.1, p=0.39], whereas individual neuronal activity was decreased after cocaine (c). Mean Ca2+N fluorescence was increased (1.86±0.15%, [F(14,56)=8.16, p<0.001, n=5] in the anesthetized state (updated from Park et al.78).
Fig. 7
Fig. 7
Dynamic recording of neuronal Ca2+ in the medial prefrontal cortex (mPFC) in response to tonic-like (0.3  mA/5  Hz/3  s, 15 pulses) and phasic-like (0.3  mA/50  Hz/0.3  s, 15 pulses) ventral tegmental area (VTA) stimulation. (a) The experimental setup showing MIP. (a’) GCaMP expression localized in mPFC. (b) Fluorescence change ΔCa2+ (solid red trace) evoked by a tonic-like stimulation (the blue-dashed trace indicates the accumulative increase ΔCa2+C). (c) Timelapse images of transient responses Ca2+T to individual pulse series of ‘tonic-like’ stimulation. (d) Spatial-temporal evolution of neuronal calcium ΔCa2+C reactivity. (e)–(g) Phasic-like VTA stimulation. (e) A representative image of neuronal Ca2+ in mPFC during VTA stimulation (t0.2  s). (f1–f5) Timelapse images of accumulative Ca2+ increase before (t<0  s) and after phasic-like VTA stimulation (t>0  s). (h) The temporal profile of ΔCa2+(t) during a phasic-like stimulation. (e’) A zoomed-in version of the yellow-dashed box in panel (e), demonstrating cellular resolution to capture individual GCaMP6f neuronal Ca2+ signals (n=1,,10). (g) Intracellular ΔCa2+(t) within these 10 neurons (N=1,,10) during a phasic-like stimulation. They showed a highly synchronized, strong response (modified from Park et al.80).
Fig. 8
Fig. 8
(a) fl-ODM imaging system integrated 3D μOCA/μODT and two-channel fluorescence imaging for simultaneous imaging microvasculature and CBF velocity within FOV of 2.4×2×1.2  mm3 and neuronal and astrocytic Ca2+ fluorescence imaging (4×3  mm2) of the mouse cortex. It was modified based on a Nikon FN-1 microscope using a broadband 5× obj. (e.g., LSM03, Thorlabs). (b) Viral injection to express Ca2+ in astrocytes (Ca2+A, GCaMP6f) and neurons (Ca2+N, jRGECO1a) in the cortex of GFAP-cre mice). (c) Mean ΔCa2+A (green), ΔCa2+N (red), and vascular ΔCBF velocity (black) responses to cocaine (1  mg/kg, i.v.), to compare cocaine’s effects on neuronal Ca2+N, astrocytic Ca2+A fluorescence, and vascular CBF velocity in the PFC (n=7 mice). (d1–d3) In vivo images of Ca2+A (GCaMP6f), Ca2+N (jRGECO1a) channels, and the merged images with the ex vivo evidence of cell-specific expressions (d1’, d2’) (updated from Du et al.47).

Similar articles

References

    1. He G. Q., et al. , “Cocaine-induced cerebrovasospasm and its possible mechanism of action,” J. Pharmacol. Exp. Ther. 268, 1532–1539 (1994).JPETAB - PubMed
    1. Hanlon C. A., et al. , “Loss of laterality in chronic cocaine users: an fMRI investigation of sensorimotor control,” Psychiatry Res. 181, 15–23 (2010).10.1016/j.pscychresns.2009.07.009 - DOI - PMC - PubMed
    1. Johnson B. A., et al. , “Treatment advances for cocaine-induced ischemic stroke: focus on dihydropyridine-class calcium channel antagonists,” Am. J. Psychiatry 158, 1191–1198 (2001).10.1176/appi.ajp.158.8.1191 - DOI - PubMed
    1. Lu H., et al. , “Cocaine-induced brain activation detected by dynamic manganese-enhanced magnetic resonance imaging (MEMRI),” Proc. Natl. Acad. Sci. U. S. A. 104, 2489–2494 (2007).10.1073/pnas.0606983104 - DOI - PMC - PubMed
    1. Volkow N. D., et al. , “Cerebral blood flow in chronic cocaine users: a study with positron emission tomography,” Br. J. Psychiatry 152, 641–648 (1988).BJPYAJ10.1192/bjp.152.5.641 - DOI - PubMed