Single-cell transcriptomic analysis of canine insulinoma reveals distinct sub-populations of insulin-expressing cancer cells
- PMID: 40438247
- PMCID: PMC12106163
- DOI: 10.1186/s44356-025-00026-3
Single-cell transcriptomic analysis of canine insulinoma reveals distinct sub-populations of insulin-expressing cancer cells
Abstract
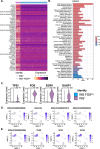
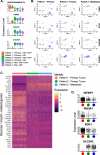
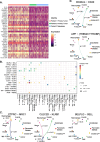
Canine malignant insulinoma is a rare, highly metastatic and life-threatening neuroendocrine tumour of pancreatic beta cells. To map the single-cell transcriptomic landscape of canine insulinoma for the first time, transcriptomic profiles of 5,532 cells were captured from two spontaneous insulinomas (Patient 1 and 2) and one associated metastasis (Patient 2) in two Boxer dogs. Distinct cancer, endocrine, and immune cell populations were identified. Notably, all three tumour samples contained two transcriptionally distinct insulin-expressing tumour cell populations (INS+ and INS+FOS low ), characterised here for the first time. These two cancer cell populations significantly differed by ~ 8,000 differentially expressed genes (DEGs), particularly tumour suppressor genes (e.g. TP53, EGR1) and cancer-related pathways (e.g., MAPK, p53). In contrast, COX7A2L was one of a few genes ubiquitously expressed and significantly upregulated (> 20-fold) in both insulin-expressing tumour populations compared to other captured populations. Both populations were also characterised by expression of chromogranin/secretogranin neuroendocrine tumour marker genes (e.g. CHGA, SCGN). There were far fewer gene expression differences observed between insulin-expressing tumour cells from the two patients (~ 600 DEGs) than between the two cancer cell populations within each patient. These DEGs included CLTRN, TMSB4X, CSRP2, LGALS2, and C15orf48. Unexpectedly for a tumour of endocrine origin, the metastasis in Patient 2 exhibited > 20-70 fold upregulation of exocrine pancreatic genes including CLPS, PRSS2, PRSS and CTRC. Immune cell analyses identified distinct infiltrating immune populations, including memory T cells and macrophages and revealed likely tumour-immune interactions, including the CD40-CD40L interaction. This study provides the first single-cell RNA sequencing (scRNA-seq) analysis of naturally occurring insulinoma in any species, revealing tumour cell heterogeneity, novel immune microenvironment features, and potential therapeutic targets. Despite its small scale, the findings highlight the utility of scRNA-seq in veterinary oncology and its translational potential for pancreatic neuroendocrine tumours across species.
Supplementary information: The online version contains supplementary material available at 10.1186/s44356-025-00026-3.
Keywords: Boxer; EGR1; P53; canine; insulinoma; scRNA-seq.
© The Author(s) 2025.
Conflict of interest statement
Competing interests The authors declare no competing interests.
Figures


Similar articles
-
Single-cell transcriptome conservation in a multispecies comparative analysis of fresh and cryopreserved insulinoma cell lines.Vet Oncol. 2025;2(1):14. doi: 10.1186/s44356-025-00025-4. Epub 2025 May 27. Vet Oncol. 2025. PMID: 40438246 Free PMC article.
-
Transcriptomic analysis by RNA sequencing characterises malignant progression of canine insulinoma from normal tissue to metastatic disease.Sci Rep. 2020 Jul 14;10(1):11581. doi: 10.1038/s41598-020-68507-z. Sci Rep. 2020. PMID: 32665562 Free PMC article.
-
Chromogranin A plasma concentration and expression in pancreatic islet cell tumors of dogs and cats.Am J Vet Res. 1997 Jun;58(6):615-20. Am J Vet Res. 1997. PMID: 9185968
-
Current Trends in Diagnosis, Treatment and Prognosis of Canine Insulinoma.Vet Sci. 2022 Sep 29;9(10):540. doi: 10.3390/vetsci9100540. Vet Sci. 2022. PMID: 36288153 Free PMC article. Review.
-
Canine insulinoma as a model for human malignant insulinoma research: Novel perspectives for translational clinical studies.Transl Oncol. 2022 Jan;15(1):101269. doi: 10.1016/j.tranon.2021.101269. Epub 2021 Nov 15. Transl Oncol. 2022. PMID: 34794032 Free PMC article. Review.
References
-
- Adamopoulos PG, Raptis GD, Kontos CK, Scorilas A. Discovery and expression analysis of novel transcripts of the human SR-related CTD-associated factor 1 (SCAF1) gene in human cancer cells using Next-Generation Sequencing. Gene. 2018;670:155–65. - PubMed
-
- Birkenkamp-Demtröder K, Wagner L, Brandt Sørensen F, Bording Astrup L, Gartner W, Scherübl H, Heine B, Christiansen P, ørntofT, T. F. Secretagogin is a novel marker for neuroendocrine differentiation. Neuroendocrinology. 2005;82:121–38. - PubMed
LinkOut - more resources
Full Text Sources
Research Materials
Miscellaneous
