

The Impact of Triglycerides on Rheumatoid Arthritis: Risk Factor and Mendelian Randomization Study
- PMID: 40438251
- PMCID: PMC12117706
- DOI: 10.2147/OARRR.S513774
The Impact of Triglycerides on Rheumatoid Arthritis: Risk Factor and Mendelian Randomization Study
Abstract
Objective: This study investigates the association between triglycerides and Rheumatoid arthritis (RA) risk through risk factor analysis and Mendelian randomization (MR).
Methods: Data from the Dryad database were used for a case-control study with 455 participants (224 with RA and 231 controls), with a median age of 54 years (IQR: 45-62) and 34% male participants. Logistic regression analyses identified risk factors, and correlation coefficient analysis assessed associations between triglycerides and RA. A two-sample MR analysis was conducted using genetic variants associated with triglyceride levels as instrumental variables.
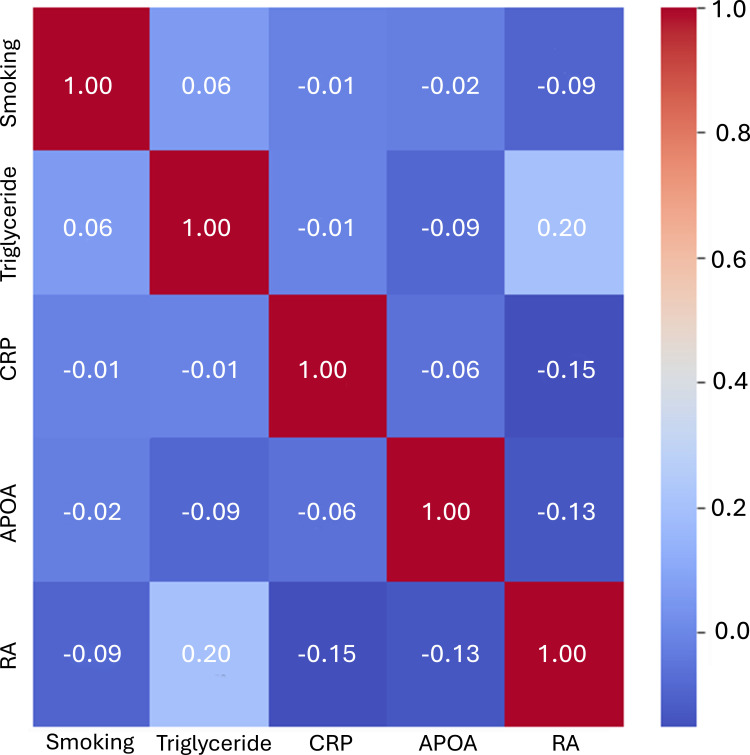
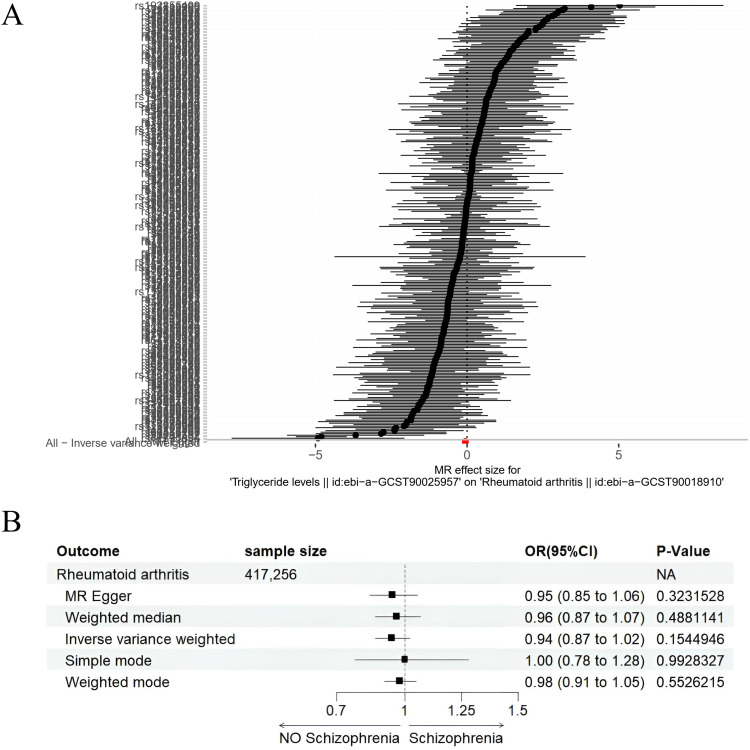
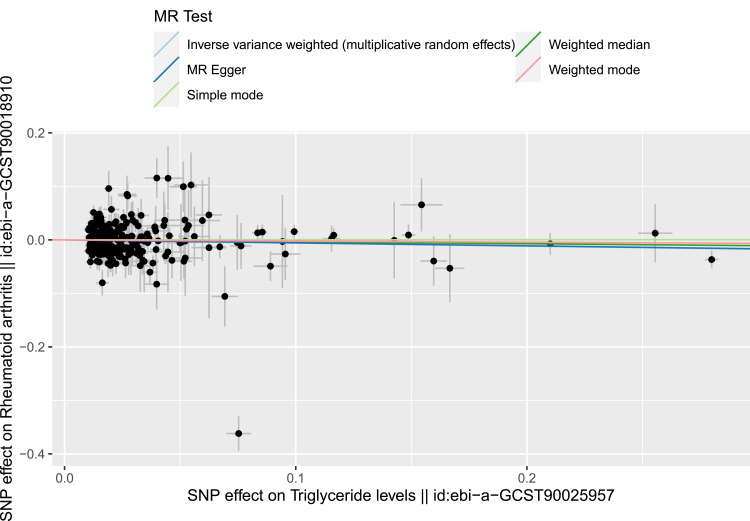
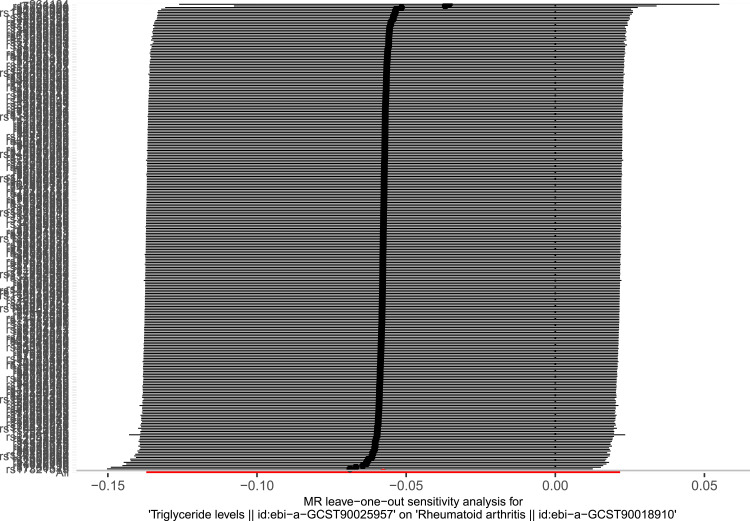
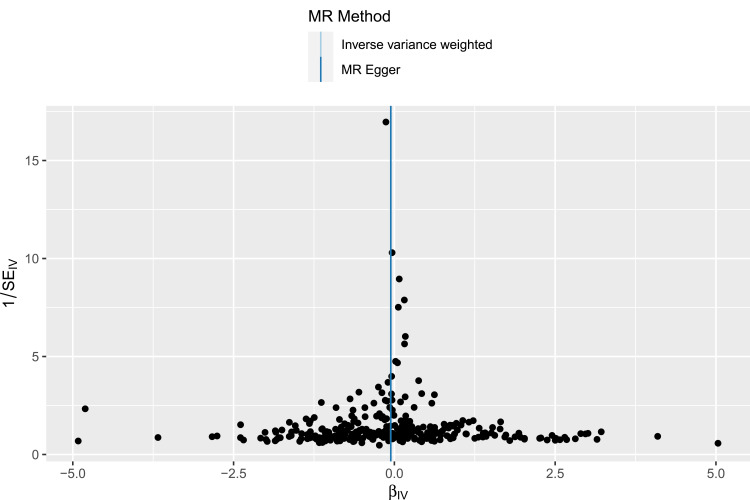
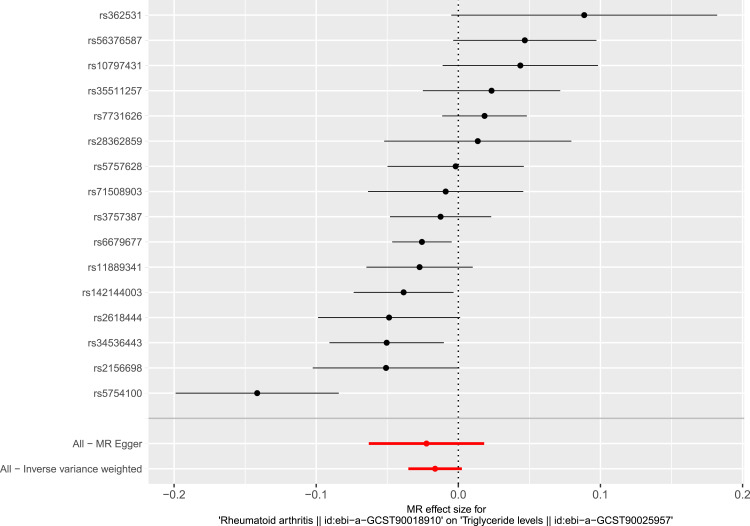
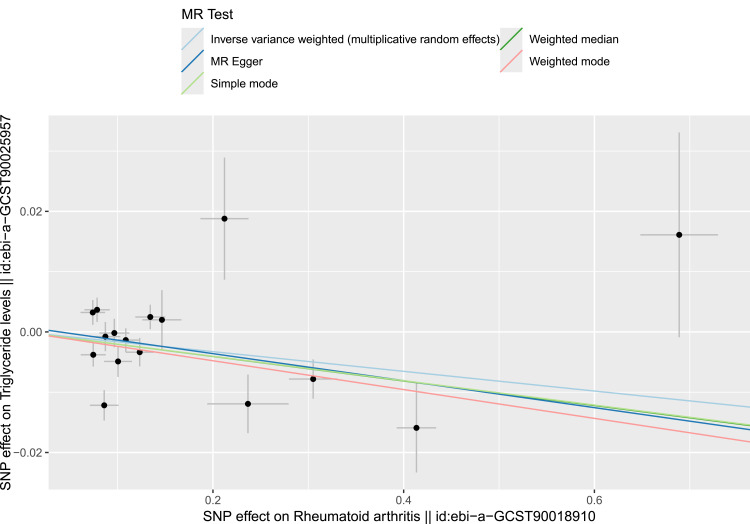
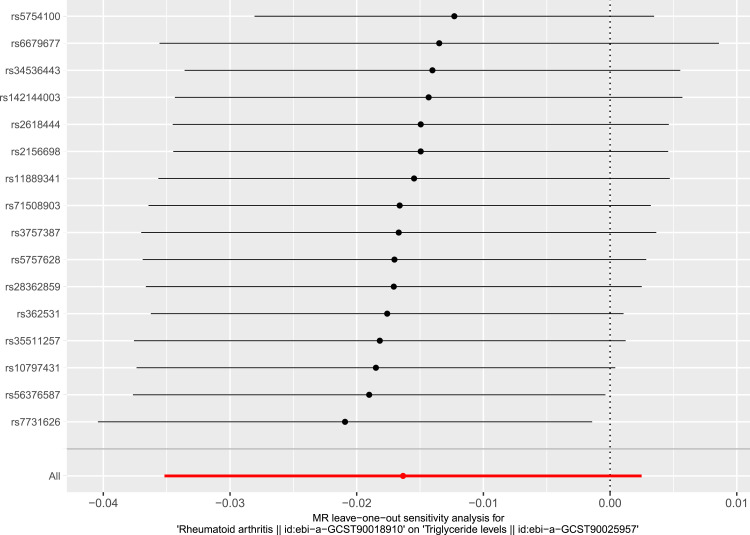
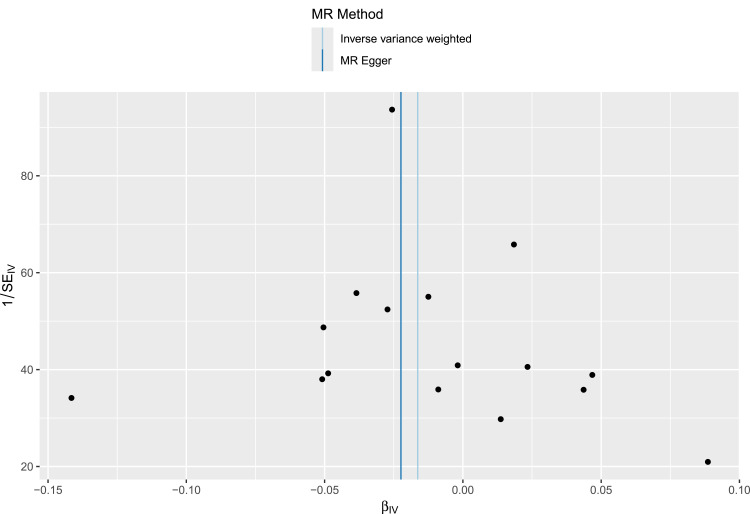
Results: Logistic regression identified higher triglyceride levels, a history of non-smoking, lower levels of C-reactive protein, and apolipoprotein A as significant risk factors for RA (all P < 0.05). MR analysis showed no significant causal relationship, with odds ratios (IVW OR = 0.944, P = 0.154) close to 1. Heterogeneity tests showed no significant variation in causal estimates, supporting the absence of a causal link between triglycerides and RA.
Conclusion: While elevated triglyceride levels are associated with an increased risk of RA, MR suggests that triglycerides do not play a direct causal role in its development. These findings indicate that triglyceride management may not be a primary focus in RA treatment, but further research into the mechanisms underlying RA progression is needed.
Keywords: Mendelian randomization; causal relationship; rheumatoid arthritis; risk factor; triglycerides.
© 2025 Liu and Liang.
Conflict of interest statement
The authors report no competing interests in this work.
Figures
Similar articles
-
Exploring the causal association of rheumatoid arthritis with atrial fibrillation: a Mendelian randomization study.Clin Rheumatol. 2024 Jan;43(1):29-40. doi: 10.1007/s10067-023-06804-4. Epub 2023 Nov 6. Clin Rheumatol. 2024. PMID: 37930596
-
Causal relationship between rheumatoid arthritis and carpal tunnel syndrome: a bidirectional two-sample Mendelian randomization study.J Orthop Surg Res. 2024 Sep 30;19(1):613. doi: 10.1186/s13018-024-05059-2. J Orthop Surg Res. 2024. PMID: 39343950 Free PMC article.
-
Causal association between periodontitis and risk of rheumatoid arthritis and systemic lupus erythematosus: a Mendelian randomization.Z Rheumatol. 2020 Nov;79(9):929-936. doi: 10.1007/s00393-019-00742-w. Z Rheumatol. 2020. PMID: 31965238 English.
-
Analysis of the causal relationship between immune cells and rheumatoid arthritis from the perspective of genetic variation: a bidirectional two-sample Mendelian randomization study.Adv Rheumatol. 2024 Nov 1;64(1):83. doi: 10.1186/s42358-024-00425-4. Adv Rheumatol. 2024. PMID: 39487558 Review.
-
Modifiable environmental exposure and risk of rheumatoid arthritis-current evidence from genetic studies.Arthritis Res Ther. 2020 Jun 22;22(1):154. doi: 10.1186/s13075-020-02253-5. Arthritis Res Ther. 2020. PMID: 32571398 Free PMC article. Review.
References
Associated data
LinkOut - more resources
Full Text Sources
Research Materials
