. 2025 May 14:19:1525130.
doi: 10.3389/fncir.2025.1525130. eCollection 2025.

Disrupted functional connectome in a rodent model of autism during social isolation

Affiliations

Disrupted functional connectome in a rodent model of autism during social isolation

Robert Gergely Kemecsei et al. Front Neural Circuits. .

Abstract

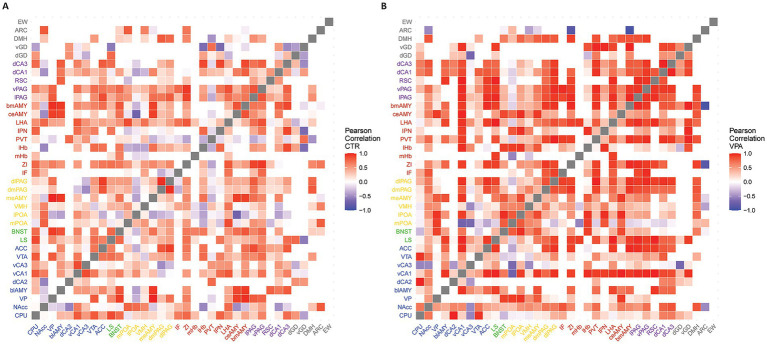
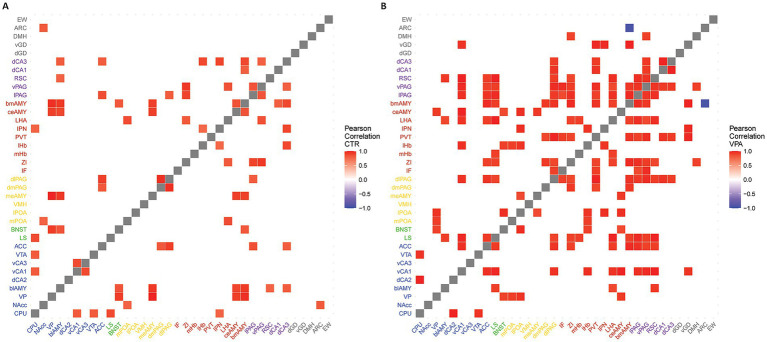
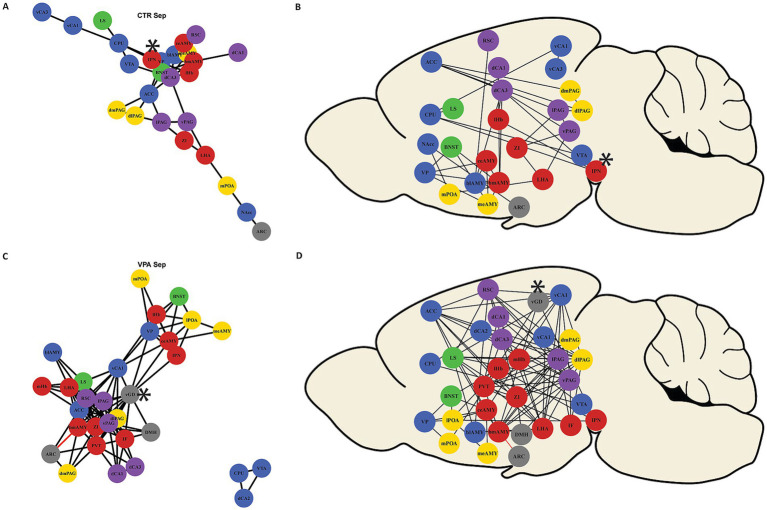
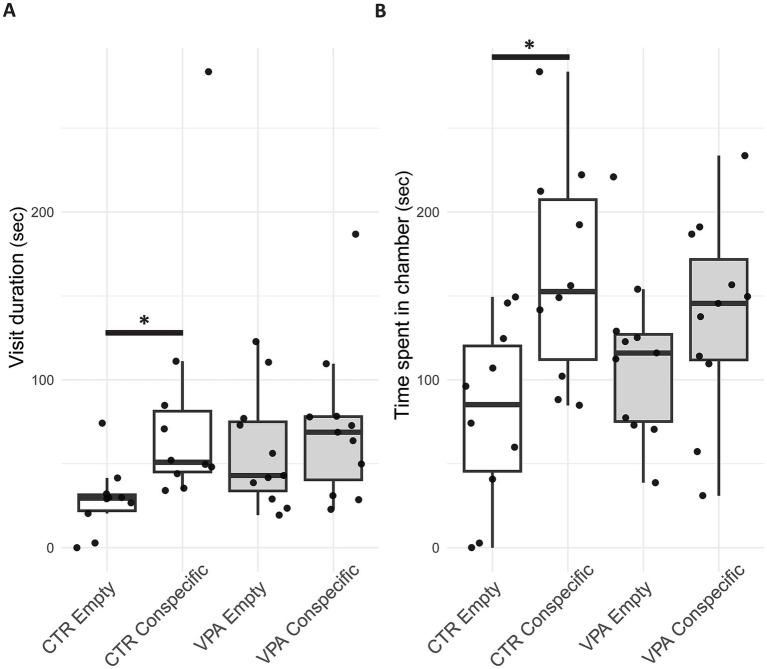
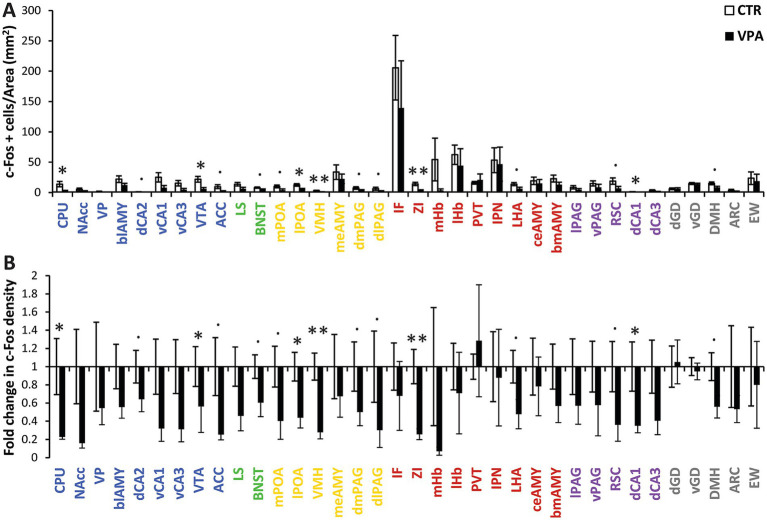
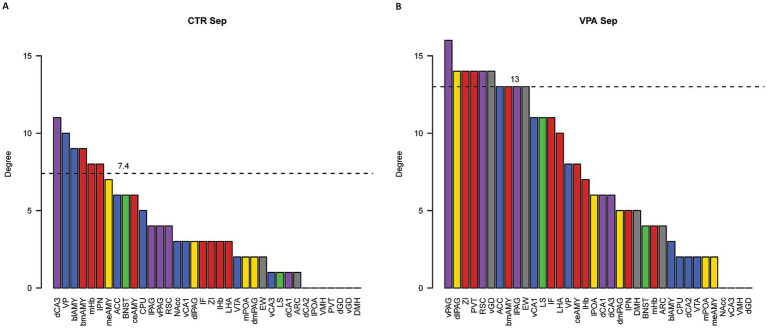
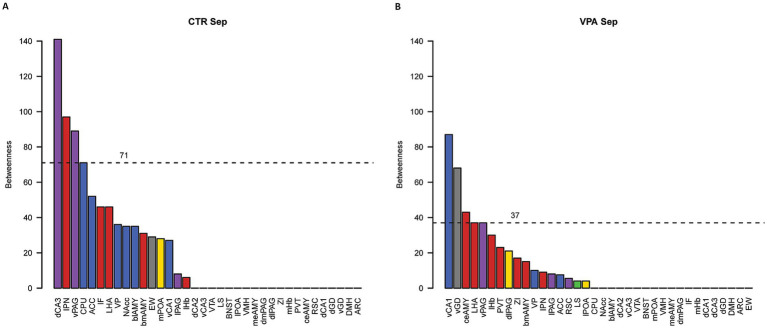
Autism spectrum disorder (ASD) is associated with disruptions in social behavior and the neural circuitry behind it. Very little data is available on the mechanisms that are responsible for the lack of motivation to reunite with conspecifics during isolation. It is as important to investigate the neural changes that reduce motivation to end social isolation, as those underlying the reactions to social stimuli. Using a rodent model of prenatal valproic acid (VPA) exposure, we investigated how social isolation affects the neural activation of key brain nuclei involved in social processing and stress regulation. Juvenile male C57BL/6 mice were treated prenatally with VPA or saline (CTR) and subjected to 24 h of social isolation from their cage mates, with neural activity assessed via c-Fos immunohistochemistry. Based on correlational activations we reconstructed and analyzed the functional connectome of the observed brain regions. Control animals exhibited elevated c-Fos expression in the regions central to the mesolimbic reward system (MRS), social brain network (SBN), and stress-related networks, with the interpeduncular nucleus (IPN) at the core, compared to VPA-treated animals. Functional network analysis revealed a more widespread but less specific pattern of connectivity in VPA-treated animals. These findings suggest that prenatal VPA exposure disrupts certain neural circuits related to social behavior and stress regulation, offering an insight into the altered perception of social isolation in ASD models, and highlighting potential therapeutic targets.

Keywords: VPA; autism spectrum disorder; functional connectivity; social decision making network; social isolation; stress regulating network; valproic acid.


Conflict of interest statement

The authors declare that the research was conducted in the absence of any commercial or financial relationships that could be construed as a potential conflict of interest. The author(s) declared that they were an editorial board member of Frontiers, at the time of submission. This had no impact on the peer review process and the final decision.

Figures

Figure 1
Figure 1
Heatmaps representing the functional connectivity between brain regions. The heatmaps depict the functional connectivity between brain regions, based on the correlation coefficients (R2, Pearson correlation) of their activation patterns. Red represents positive correlations, while blue indicates negative correlations. White squares represent no correlation or regions not connected physiologically according to the connectome used. (A) Heatmap representing the network of socially separated CTR animals. (B) Heatmap representing the network of socially separated VPA-treated mice.
Figure 2
Figure 2
Heatmaps of functionally strongly connected areas. The heatmaps illustrate the functionally strongly connected brain regions. Functional connections were calculated based on the correlational strength of the activation in each nucleus. In the first step, the correlation matrices were thresholded using connectome data to reflect only physiologically connected areas. In the second step, matrices were further thresholded by correlational strength to display strong and significant connections (|R2| > 0.7, p < 0.05). Red areas indicate strong positive correlations, blue areas represent strong negative correlations, and white areas denote connections excluded either by the connectome thresholding or due to weak correlational strength. Panel (A) represents the heatmap of the CTR animals, while panel (B) shows the heatmap of the VPA-treated animals.
Figure 3
Figure 3
Network constructed by strong functional connections (|R2| > 0.7, p < 0.05). The network illustrates strong functional connections between brain regions. Black edges represent positive correlations, while red edges indicate negative correlations. Nodes represent the brain areas, and the colors of the circles correspond to the hypothesized subnetwork to which they belong (as shown in Figure 5). Panel (A) presents the functional network of control (CTR) mice. Panel (B) shows the connected nuclei in their approximate anatomical positions from a sagittal view. Panel (C) illustrates the more interconnected network of VPA-treated animals. Panel (D) represent the connected nuclei in their approximate anatomic position in the brain. Regions that had been identified as hubs (see text and Figures 6, 7) had been labeled by an asterisk.
Figure 4
Figure 4
Boxplot of the three-chamber sociability test panel (A) shows the average time per visit (duration between the enter and exit into a chamber) spent by control (CTR) and valproate (VPA) treated mice in the chamber containing the conspecific (in a small cage) versus the chamber containing the empty cage. Panel (B) represents the total time spent by CTR and VPA-treated animals in the chamber with a conspecific compared to the empty chamber. Boxplot elements represent the median (horizontal line), interquartile range (box), min-max (whiskers) and outliers (dots outside whisker range).
Figure 5
Figure 5
Activation patterns in regions of interest (ROIs) (A) the mean (± SEM) c-Fos density (number of c-Fos-positive cells per mm2) across different brain regions. The colors indicate the subnetworks to which the nuclei belong: blue represents the mesolimbic reward system (MRS), yellow represents the social behavior network (SBN), green represents overlapping nuclei that belong to both the MRS and SBN, red denotes nuclei involved in regulating stress (both social and non-social), purple represents regions not directly involved in social behavior but associated with autism-related activation or morphological differences, and gray represents control regions with vegetative functions or no described relation to social behavior or autism. (B) The same data are represented as fold change in c-Fos-positive cell density between control (CTR) and VPA-treated animals. The baseline value (1) represents the average activation density in the CTR group. Differences are indicated at three levels: a dot (.) represents marginal differences in activation density (0.05 < p < 0.1) with a high effect size (Cohen’s d > 0.8), a single asterisk (*) indicates significant differences (p < 0.05), and a double asterisk (**) indicates significant differences with adjusted p < 0.05 after FDR correction. Bars represent mean (± SEM).
Figure 6
Figure 6
Degree centrality analysis of functional networks. Panel (A) shows the degree centrality values for control (CTR) mice, while panel (B) displays the values for VPA-treated mice. Degree centrality values represent the total number of edges connected to each nucleus. The dashed lines indicate the 80th percentile cutoff for centrality values, used to identify local hub nuclei with degree centrality values above this threshold. Bar colors indicate the subnetwork affiliations of the nuclei: blue represents the mesolimbic reward system (MRS), yellow represents the social behavior network (SBN), green represents overlapping nuclei belonging to both the MRS and SBN, red denotes nuclei involved in regulating stress (both social and non-social), purple represents regions not directly involved in social behavior but associated with autism-related activation or morphological differences, and gray represents control regions with vegetative functions or no observed changes related to social behavior or autism.
Figure 7
Figure 7
Betweenness centrality analysis of functional networks. Panel (A) shows the betweenness centrality values for control (CTR) mice, while panel (B) displays the values for VPA-treated mice. Betweenness centrality values indicate the central position of each nucleus within the network. The dashed lines represent the 80th percentile cutoff for centrality values, used to identify hub nuclei with high betweenness centrality values above this threshold. Bar colors indicate the subnetwork affiliations of the nuclei: blue represents the mesolimbic reward system (MRS), yellow represents the social behavior network (SBN), green represents overlapping nuclei belonging to both the MRS and SBN, red denotes nuclei involved in regulating stress (both social and non-social), purple represents regions not directly involved in social behavior but associated with autism-related activation or morphological differences, and gray represents control regions with vegetative functions or no observed changes related to social behavior or autism.

Similar articles

References

    1. Ables J. L., Park K., Ibañez-Tallon I. (2023). Understanding the Habenula: a major node in circuits regulating emotion and motivation. Pharmacol. Res. 190:106734. doi: 10.1016/j.phrs.2023.106734 - DOI - PMC - PubMed
    1. Ádám Á., Kemecsei R., Company V., Murcia-Ramón R., Juarez I., Gerecsei L. I., et al. . (2020). Gestational exposure to sodium valproate disrupts fasciculation of the Mesotelencephalic dopaminergic tract, with a selective reduction of dopaminergic output from the ventral tegmental area. Front. Neuroanat. 14:29. doi: 10.3389/fnana.2020.00029, PMID: - DOI - PMC - PubMed
    1. Ahmadlou M., Houba J. H. W., van Vierbergen J. F. M., Giannouli M., Gimenez G. A., van Weeghel C., et al. . (2021). A cell type-specific cortico-subcortical brain circuit for investigatory and novelty-seeking behavior. Science 372:6543. doi: 10.1126/science.abe9681, PMID: - DOI - PubMed
    1. Ahmed S., Hanif A., Khaliq I., Ayub S., Saboor S., Shoib S., et al. . (2024). Psychological impact of the COVID-19 pandemic in children with autism spectrum disorder - a literature review. Int. J. Dev. Disabil. 70, 173–183. doi: 10.1080/20473869.2022.2066248, PMID: - DOI - PMC - PubMed
    1. Atlas Thumbnails (2024) Allen brain atlas: Mouse brain. Available online at: https://mouse.brain-map.org/experiment/thumbnails/100048576?image_type=a... (accessed August 9, 2024).

Substances

LinkOut - more resources