

Mortality risk in patients with myasthenia gravis
- PMID: 40438573
- PMCID: PMC12116355
- DOI: 10.3389/fneur.2025.1586031
Mortality risk in patients with myasthenia gravis
Abstract
Introduction: Although some reports link Myasthenia Gravis to higher mortality, the evidence remains contradictory and unclear. Real-life data is limited primarily due to challenges in selecting control groups and mitigating bias. Additionally, a revised mortality assessment should be conducted due to recent advancements in Myasthenia Gravis treatments over the past decade, including new biological therapies and the impact of the COVID-19 pandemic from 2020 to 2023.
Methods: We conducted a retrospective analysis of all patients diagnosed with Myasthenia Gravis at our tertiary center between 2000 and 2023, extracting mortality and clinical features compared to two age- and sex-matched control groups of neurological or rheumatologic patients.
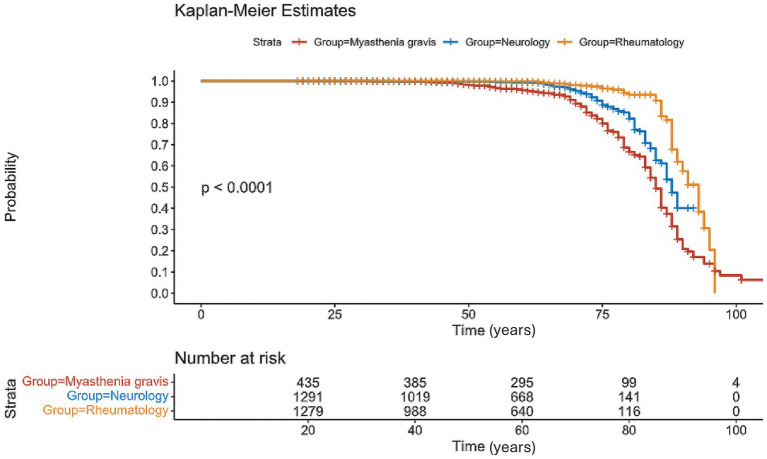
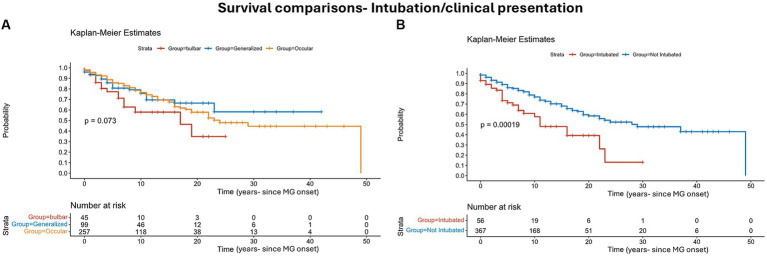
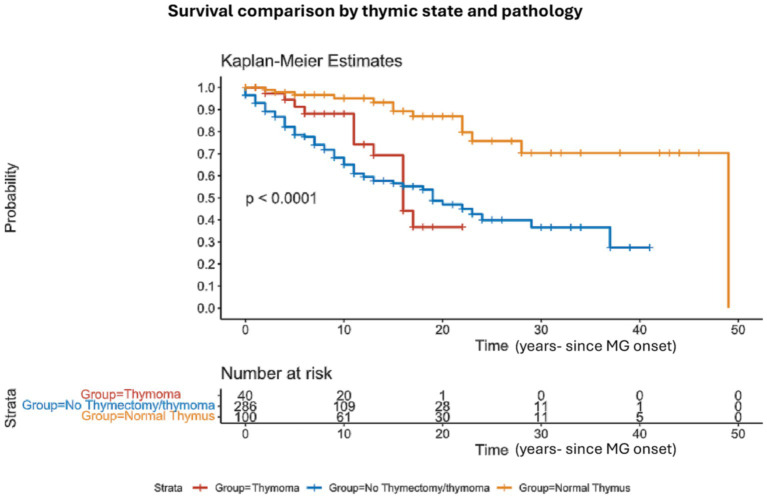
Results: We identified 436 Myasthenic patients and 2,616 controls (1308 in each control group). Myasthenia Gravis mortality was 14% at 5 years (61/422) and 21% at 10 years (87/422). Mortality was significantly higher than control groups (p < 0.001). Intubations during myasthenic crisis were linked to higher mortality (p = 0.002). Bulbar weakness at presentation showed higher mortality but did not reach clinical significance. We compared the mean age at death in MG patients to national life expectancy benchmarks using a one-sample Z-test, revealing significantly younger age at death in both males (78.3 vs. 81.6 years, p = 0.009) and females (76.5 vs. 85.2 years, p < 0.00001). Patients with normal thymic pathology showed better outcomes and lower mortality after thymic removal (p < 0.0001). The primary cause of death was linked to infections, significantly correlated with chronic steroid use.
Discussion: In conclusion, patients with Myasthenia Gravis had higher mortality rates. Thymic removal reduced mortality, while intubation is associated with increased mortality risk.
Keywords: epidemiology; mortality; myasthenia gravis; myasthenic crisis; survival; thymectomy.
Copyright © 2025 Khateb and Shelly.
Conflict of interest statement
The authors declare that the research was conducted in the absence of any commercial or financial relationships that could be construed as a potential conflict of interest.
Figures
Similar articles
-
Intravenous immunoglobulin to prevent myasthenic crisis after thymectomy and other procedures can be omitted in patients with well-controlled myasthenia gravis.Ther Adv Neurol Disord. 2019 Jul 17;12:1756286419864497. doi: 10.1177/1756286419864497. eCollection 2019. Ther Adv Neurol Disord. 2019. PMID: 31360225 Free PMC article.
-
Thymectomy in myasthenia gravis: proposal for a predictive score of postoperative myasthenic crisis.Eur J Cardiothorac Surg. 2014 Apr;45(4):e76-88; discussion e88. doi: 10.1093/ejcts/ezt641. Epub 2014 Feb 12. Eur J Cardiothorac Surg. 2014. PMID: 24525106
-
Impact of Thymectomy on Crisis Incidence and Quality of Life amongst Generalised Myasthenia Gravis Patients.Neurol India. 2022 Nov-Dec;70(6):2427-2431. doi: 10.4103/0028-3886.364067. Neurol India. 2022. PMID: 36537428
-
Rituximab for the Treatment of Myasthenia Gravis: A 2021 Update [Internet].Ottawa (ON): Canadian Agency for Drugs and Technologies in Health; 2021 Apr. Ottawa (ON): Canadian Agency for Drugs and Technologies in Health; 2021 Apr. PMID: 34255447 Free Books & Documents. Review.
-
Chemotherapy-induced myasthenic crisis in thymoma treated with primary chemotherapy with curative intent on mechanical ventilation: a case report and review of the literature.J Med Case Rep. 2021 Feb 2;15(1):32. doi: 10.1186/s13256-020-02601-8. J Med Case Rep. 2021. PMID: 33526108 Free PMC article. Review.
Cited by
-
Malignancy in neuromuscular patients on chronic IVIG.Front Neurol. 2025 Jun 24;16:1571160. doi: 10.3389/fneur.2025.1571160. eCollection 2025. Front Neurol. 2025. PMID: 40630912 Free PMC article.
References
LinkOut - more resources
Full Text Sources
Miscellaneous