. 2025 May 14:16:1545608.
doi: 10.3389/fneur.2025.1545608. eCollection 2025.

Biomarker identification associated with M2 tumor-associated macrophage infiltration in glioblastoma

Affiliations

Biomarker identification associated with M2 tumor-associated macrophage infiltration in glioblastoma

Xue-Yuan Li et al. Front Neurol. .

Abstract

Purpose: M2 phenotype tumor-associated macrophages (TAMs) can promote tumor growth, invasion, chemotherapy resistance and so on, leading to malignant progression. The aim of this study was to identify novel prognostic profiles in glioblastoma (GBM) by integrating single-cell RNA sequencing (scRNA-seq) with bulk RNA-seq.

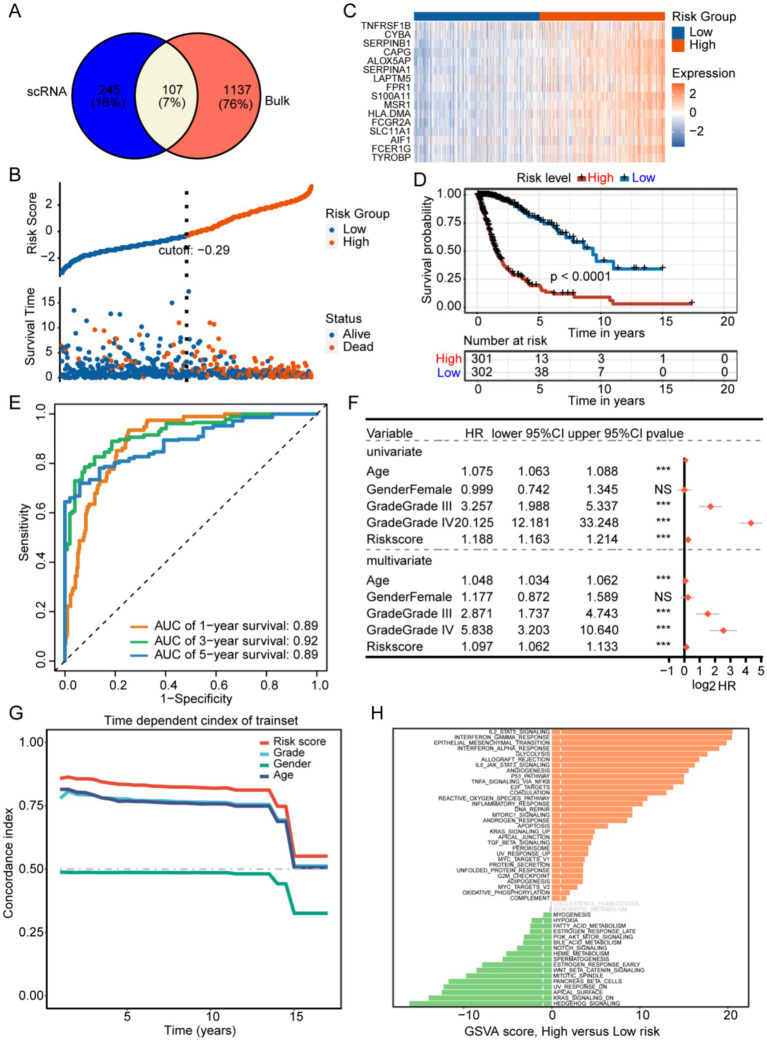
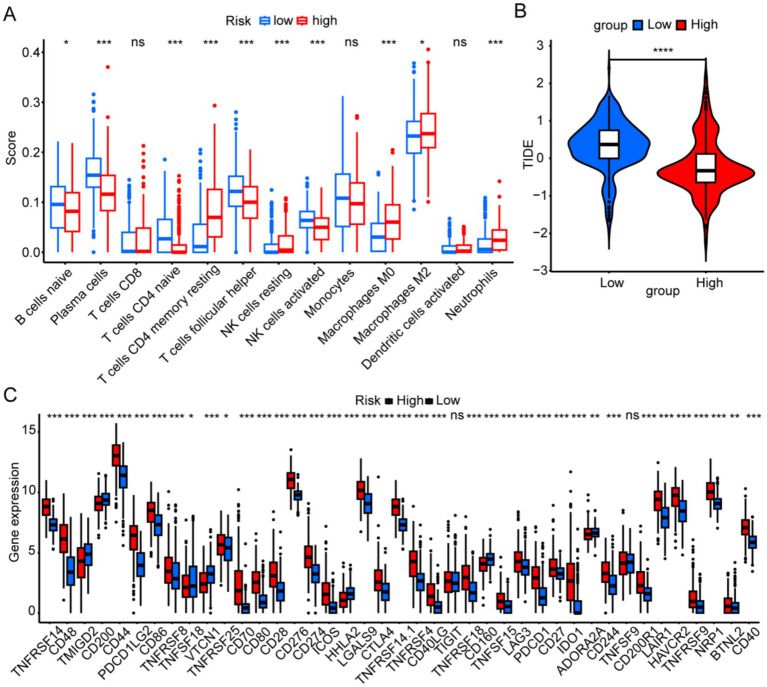
Methods: We identified M2-associated genes by intersecting TAM marker genes derived from scRNA-seq with macrophage module genes from WGCNA RNA-seq data. Prognostic M2 TAM-related genes were determined using univariate Cox and LASSO regression analyses. In the following steps, prognostic characteristics, risk groups, and external validation were constructed and validated. The immune landscape of patients with GBM was examined by evaluating immune cells, functions, evasion scores, and checkpoint genes.

Results: Analysis of scRNA-seq and bulk-seq data revealed 107 genes linked to M2 TAMs. Using univariate Cox and LASSO regression, 16 genes were identified as prognostic for GBM, leading to the creation and validation of a prognostic signature for GBM survival prediction.

Conclusion: Our findings reveal the immune landscape of GBM and enhance understanding of the molecular mechanisms associated with M2 TAMs.

Keywords: glioblastoma; immune landscape; prognostic signature; single cell; tumor-associated macrophage.


Conflict of interest statement

The authors declare that the research was conducted in the absence of any commercial or financial relationships that could be construed as a potential conflict of interest.

Figures

Figure 1
Figure 1
Diagram illustrating the data processing and analysis workflow.
Figure 2
Figure 2
Identification of M2 TAM-associated genes in glioma using WGCNA. (A-D) Groups with elevated immune and microenvironment scores and higher levels of macrophages and M2 macrophages exhibited significantly poorer prognoses. (E) Samples were clustered without identifying any outliers. (F-G) The WGCNA package determined a soft threshold power of 9. (H) Correlation analysis identified seven non-gray modules associated with traits. (I) The turquoise module was identified as the most relevant module for M2 macrophages.
Figure 3
Figure 3
Acquisition of TAM marker genes using scRNA-seq data. (A) Analysis of immune components using t-SNE from 15 patients with glioma, based on the GSE147275 database, identified nine main clusters: NK cells, macrophages, T cells, microglia, neutrophils, APCs, B cells, proliferative cells, and unclassified cells. (B) The heatmap displays marker genes that exhibit differential expression in immune cells. (C–J) t-SNE of immune constituents showed representative markers for the following populations: (C) NK cells (KLRD1 and NKG7), (D) macrophages (CD68 and CD163), (E) T cells (CD3D and CD3G), (F) microglia (P2RY12 and CX3CR1), (G) neutrophils (S100A8 and S100A9), (H) APCs (CD74 and HLA-DRB1), (I) B cells (CD79A and MS4A1), and (J) proliferative cells (MKI67 and TOP2A).
Figure 4
Figure 4
(A) Development of a prognostic signature associated with M2 tumor-associated macrophages (TAMs) identification of potential genes associated with M2-like TAMs. (B) The training set. (C) The prognostic gene expressions are presented for different groups. (D) The high-risk group in the training set showed a significantly worse prognosis according to Kaplan–Meier survival curves. (E) The prognostic efficacy of the risk score was confirmed using the AUC of the time-dependent ROC curves. (F,G) The univariate and multivariate analyses, along with the C-index, demonstrated that the risk score was an independent risk factor affecting survival more significantly than other indicators. (H) Results of GSVA comparing high- and low-risk groups.
Figure 5
Figure 5
Prognostic signature for M2 TAMs. (A) The test set displayed risk scores, survival status, and prognostic gene expression for patients with glioma, categorized into different groups. (B) Kaplan–Meier survival curves of different risk groups. (C) ROC curves. (D) Nomogram integrating risk scores and clinical indicators. ***p < 0.001. (E) The nomogram demonstrated reliable performance, as indicated by the calibration curve.
Figure 6
Figure 6
Immune landscapes associated with the six risk signatures. (A) Immune cell scores were analyzed to compare high- and low-risk groups. (B) The tumor immune dysfunction and exclusion scores were analyzed to compare high- and low-risk groups. (C) Immune-checkpoint gene expression was analyzed between different risk groups. *p < 0.05, **p < 0.01, ***p < 0.001, and ns, not significant.
Figure 7
Figure 7
t-SNE map illustrating the expression patterns of 16 prognostic signature genes associated with M2-like TAMs.
Figure 8
Figure 8
Signature genes expression levels in GBM tissues and M2 macrophages. (A) Signature genes expression levels in GSE4290 database and (B) Rembrandt database. (C) Signature genes expression levels were significantly upregulated in THP-1-derived M2 macrophages. *p < 0.05 and **p < 0.01. (D) Immunofluorescence images of signature genes (Red) and CD163 (Green) in GBM tissue. PT, para-carcinoma tissue. The scale bar in the column represents 50 μm.

Similar articles

References

    1. Lapointe S, Perry A, Butowski NA. Primary brain tumours in adults. Lancet. (2018) 392:432–46. doi: 10.1016/S0140-6736(18)30990-5, PMID: - DOI - PubMed
    1. Ostrom QT, Gittleman H, Liao P, Vecchione-Koval T, Wolinsky Y, Kruchko C, et al. . CBTRUS statistical report: primary brain and other central nervous system tumors diagnosed in the United States in 2010–2014. Neuro-Oncol. (2017) 19:v1–v88. doi: 10.1093/neuonc/nox158, PMID: - DOI - PMC - PubMed
    1. Bruni D, Angell HK, Galon J. The immune contexture and immunoscore in cancer prognosis and therapeutic efficacy. Nat Rev Cancer. (2020) 20:662–80. doi: 10.1038/s41568-020-0285-7, PMID: - DOI - PubMed
    1. Fukumura D, Kloepper J, Amoozgar Z, Duda DG, Jain RK. Enhancing cancer immunotherapy using antiangiogenics: opportunities and challenges. Nat Rev Clin Oncol. (2018) 15:325–40. doi: 10.1038/nrclinonc.2018.29, PMID: - DOI - PMC - PubMed
    1. Hao Y, Hao S, Andersen-Nissen E, Mauck WM, 3rd, Zheng S, Butler A, et al. . Integrated analysis of multimodal single-cell data. Cell. (2021) 184:3573–3587.e29. doi: 10.1016/j.cell.2021.04.048, PMID: - DOI - PMC - PubMed

LinkOut - more resources