. 2025 May 14:15:1574911.
doi: 10.3389/fonc.2025.1574911. eCollection 2025.

Immunological features of various molecular subtypes of cervical cancer and their prognostic implications in the context of disulfidptosis

Affiliations

Immunological features of various molecular subtypes of cervical cancer and their prognostic implications in the context of disulfidptosis

Yadan Yao et al. Front Oncol. .

Abstract

Objective: Cervical cancer ranks among the most prevalent malignancies impacting women globally. Disulfidptosis represents a recently identified pathway of cellular demise, although its role in the context of cervical cancer is not well elucidated. This research investigates the significance of Disulfidptosis-Related Genes (DRGs) within cervical cancer. Furthermore, it aims to analyze the differences in prognosis and immune infiltration among different molecular subtypes.

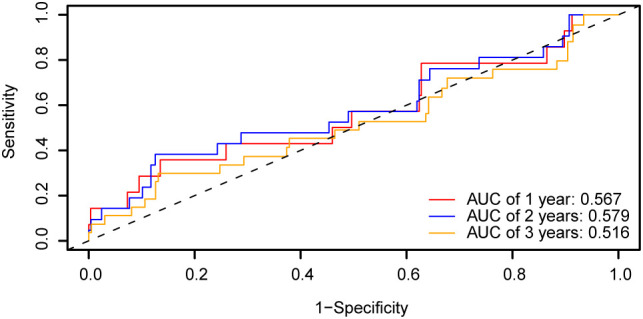
Methods: We compiled genes associated with cervical cancer and disulfidptosis from a variety of databases to perform a differential expression analysis. Subsequently, the samples are grouped through consensus clustering. To evaluate immune cell infiltration, we employed CIBERSORT. Additionally, immune checkpoint genes (ICGs) were gathered from existing literature and databases, enabling statistical analyses of two subtype samples of cervical cancer (CESC). Following our analyses using GO, KEGG, and GSEA to compare the differences between the two subtypes. Lastly, a prognostic risk model was constructed using LASSO regression and validated using ROC.

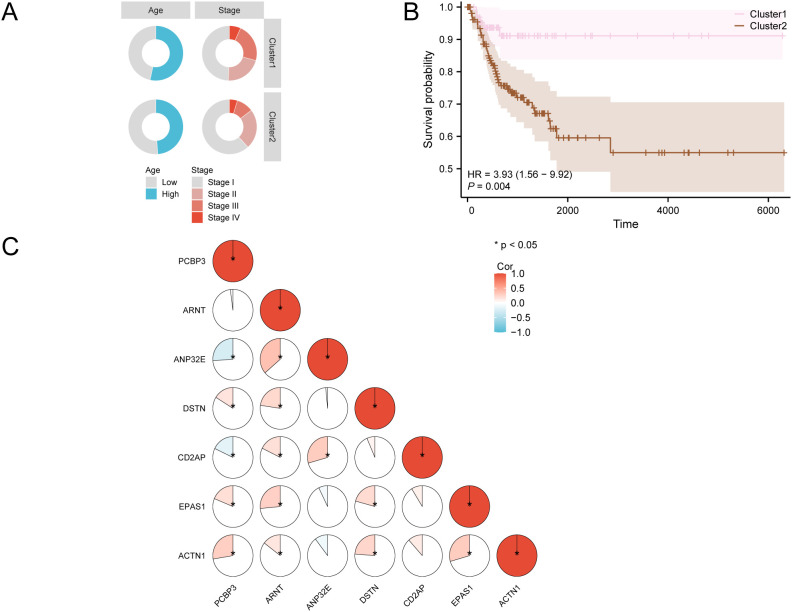
Results: This study identified seven key genes: PCBP3, ARNT, ANP32E, DSTN, CD2AP, EPAS1, and ACTN1.The consensus clustering analysis showed differences in immune cell infiltration and DFS(disease-free survival) among the various clusters. The immune checkpoint gene CXCL1 displayed highly significant statistical differences between subtype A (Cluster 1) and subtype B (Cluster 2) in cervical cancer (CESC) samples. The gene set enrichment analysis identified the negative regulation of peptidase activity and the IL-17 signaling pathway, which link to subtype-specific differentially expressed genes (DEGs).

Conclusion: Statistical analysis of the various subtypes of CESC samples highlighted the importance of subtype-specific therapeutic targets. Additionally, it seeks to enhance the accuracy of prognostic predictions, thereby establishing a foundation for the formulation of personalized treatment approaches.

Keywords: cervical cancer; disulfidptosis; immune cell infiltration; prognostic model; risk signature.


Conflict of interest statement

The authors declare that the research was conducted in the absence of any commercial or financial relationships that could be construed as a potential conflict of interest.

Figures

Figure 1
Figure 1
Flow chart for the comprehensive analysis. TCGA, The Cancer Genome Atlas; CESC, Cervical Cancer; DEGs, Differentially Expressed Genes; DRGs, Disulfidptosis-Related Genes; Unicox, Univariate Cox; GSEA, Gene Set Enrichment Analysis; ROC, Receiver Operating Characteristic; GO, Gene Ontology; KEGG, Kyoto Encyclopedia of Genes and Genomes; SSDEGs, Subtype-specific differentially expressed genes; ICG, Immune Checkpoint Genes; ICD, Immunogenic Cell Death; GSVA, Gene Set Variation Analysis.
Figure 2
Figure 2
Differential gene expression analysis. (A) Volcano plot of differentially expressed genes analysis between the CESC group and the Control (Control) group in the GTEx-TCGA-CESC. (B) DEGs, DRGs and univariate Cox gene intersection Venn diagram in the GTEx-TCGA-CESC. (C) Heat map of Key Genes in the GTEx-TCGA-CESC. The CESC group is purple, and the Control (Control) group is yellow. In the heat map, red represents high expression and blue represents low expression.
Figure 3
Figure 3
Consensus clustering analysis for CESC. (A) Consensus clustering results of CESC samples in the GTEx-TCGA-CESC. B-C. Consistency cumulative distribution function (CDF) plot (B) and Delta plot (C) of consistency clustering analysis. (D) 3D t-SNE cluster map of two disease subtypes of cervical cancer (CESC). (E) Heat map of expression values of Key Genes in CESC subtypes. (F) Group comparison map of Key Genes between the two subtypes of CESC. PCA, Principal Component Analysis. * represents p value < 0.05, statistically significant; *** represents p value < 0.001, highly statistically significant. Orange is subtype A (Cluster1) and purple is subtype B (Cluster2).
Figure 4
Figure 4
KM survival analysis of CESC. (A) Distribution of clinical features in different subtypes. (B) Prognostic KM curves for disease-free survival (DFS) of CESC samples based on subtype grouping in the GTEx-TCGA-CESC. (C) Correlation heatmap of Key Genes in the GTEx-TCGA-CESC. KM, Kaplan-Meier method.
Figure 5
Figure 5
Immune infiltration analysis by CIBERSORT algorithm. (A, B) The proportion of immune cells in CESC samples in the GTEx-TCGA-CESC bar graph (A) and group comparison graph (B). (C) Correlation heat map of immune cells in CESC samples in the GTEx-TCGA-CESC. (D) Bubble plot of correlation between immune cell infiltration abundance and Key Genes in CESC samples in GTEx-TCGA-CESC dataset. ns stands for p value ≥ 0.05, not statistically significant; * represents p value < 0.05, statistically significant; ** represents p value < 0.01 and highly statistically significant. The absolute value of correlation coefficient (r value) below 0.3 was weak or no correlation, between 0.3 and 0.5 was weak correlation, between 0.5 and 0.8 was moderate correlation, and above 0.8 was strong correlation. Orange is subgroup A (Cluster1), purple is subgroup B (Cluster2). Positive correlations are shown in red and negative ones in blue. The depth of the color represents the strength of the correlation.
Figure 6
Figure 6
Immune checkpoint genes, immunogenic cell death genes analysis. (A) Group comparison of ICG between subtype A (Cluster1) and subtype B (Cluster2) of CESC samples from the GTEx-TCGA-CESC. (B) Group comparison of ICD genes between subtype A (Cluster1) and subtype B (Cluster2) of CESC samples from the GTEx-TCGA-CESC. ns represents p value ≥ 0.05, not statistically significant; * represents p value < 0.05, statistically significant; ** represents p value < 0.01, highly statistically significant; *** represents p value < 0.001 and extremely statistically significant. Orange is subtype A (Cluster1) and purple is subtype B (Cluster2).
Figure 7
Figure 7
GSEA for risk group. (A) Volcano plot of differentially expressed genes analysis of subtype A (Cluster1) and subtype B (Cluster2) in CESC samples in the GTEx-TCGA-CESC. (B) Heat map of expression values of differentially expressed genes of subtype A (Cluster1) and subtype B (Cluster2) of cervical cancer (CESC) samples. (C) Four biological functions mountain map display of GSEA of GTEx-TCGA-CESC. D-G. GSEA showed that genes in the GTEx-TCGA-CESC were significantly enriched in HCC Progenitor Wnt Up (D), Nfkb Targets Keratinocyte Up (E), and NFKB targets keratinocyte UP (E). TNF Targets Up (F), Tgfb Emt Up (G). In the heat map, orange represents subtype A (Cluster1) and purple represents subtype B (Cluster2). In the heat map, red represents high expression and blue represents low expression. The redder the color, the smaller the adj.p value, and the bluer the larger the adj.p value. The screening criteria of GSEA were adj.p < 0.05 and FDR value (q value) < 0.25, and the p value correction method was Benjamini-Hochberg (BH).
Figure 8
Figure 8
GO and KEGG enrichment analysis. (A) Bubble plot of GO and KEGG enrichment analysis results of subtyped differential genes (SSDEGs): BP, CC, MF and KEGG). GO terms and KEGG terms are shown on the abscissa. B-E. GO and KEGG enrichment analysis results of subtype differential genes (SSDEGs) network diagram showing BP (B), CC (C), MF (D) and KEGG (E). The orange nodes represent items, the green nodes represent molecules, and the lines represent the relationship between items and molecules. The bubble size in the bubble plot represents the number of genes, and the color of the bubble represents the size of the adj.p, the redder the color, the smaller the adj. P-value, and the bluer the color, the larger the adj. P-value. The screening criteria for GO and KEGG enrichment analysis were adj.p < 0.05 and FDR value (q value) < 0.25, and the p value correction method was Benjamini-Hochberg (BH).
Figure 9
Figure 9
Cox regression analysis. (A, B). Plots of variable trajectories of the LASSO regression model (A) and prognostic model (B). (C) Forest Plot of subtype A (Cluster1) and subtype B (Cluster2) of CESC samples in the multivariate Cox regression model of 13 LASSO regression model genes in the GTEx-TCGA-CESC. LASSO (Least Absolute Shrinkage and Selection Operator).
Figure 10
Figure 10
Prognostic analysis. (A) Time-dependent ROC curves of the CESC group in the GTEx-TCGA-CESC. (B) Prognostic KM curve between RiskScore high and low groups and d DFS of the CESC sample. (C, D) Forest Plot of RiskScore and clinical information in univariate Cox regression model (C) and multivariate Cox regression model (D). (E) Nomogram of RiskScore and clinical information in univariate and multivariate Cox regression model. p value < 0.001, highly statistically significant.
Figure 11
Figure 11
Prognostic analysis. (A–C). Calibration curve of 1 year (A), 2 years (B), and 3 years (C) of the prognostic risk model for CESC. D-F. 1-year (D), 2-year (E), and 3-year (F) decision curve analysis (DCA) plots of the prognostic risk model for CESC.
Figure 12
Figure 12
Prognostic analysis. Time-dependent ROC curve of the CESC group in dataset GSE44001. ROC, Receiver Operating Characteristic Curve; AUC, Area Under the Curve.
Figure 13
Figure 13
GSVA analysis. (A, B). Heat map (A) and group comparison map (B) of gene set variation analysis (GSVA) results between subtype B (Cluster2) group and subtype A (Cluster1) group of cervical cancer (CESC) samples in the TCGA-CESC. GSVA, Gene Set Variation Analysis. *** represents p value < 0.001, highly statistically significant. Purple represents subgroup B (Cluster2) and orange represents subgroup A (Cluster1). The screening criteria for gene set variation analysis (GSVA) was adj.p < 0.05, and the p value correction method was Benjamini-Hochberg (BH). In the heat map, blue represents low enrichment and red represents high enrichment.

Similar articles

References

    1. Wu T, Lucas E, Zhao F, Basu P, Qiao Y. Artificial intelligence strengthens cervical cancer screening - present and future. Cancer Biol Med. (2024) 21:864–79. doi: 10.20892/j.issn.2095-3941.2024.0198 - DOI - PMC - PubMed
    1. Mayadev JS, Ke G, Mahantshetty U, Pereira MD, Tarnawski R, Toita T. Global challenges of radiotherapy for the treatment of locally advanced cervical cancer. Int J Gynecol Cancer. (2022) 32:436–45. doi: 10.1136/ijgc-2021-003001 - DOI - PMC - PubMed
    1. Bedell SL, Goldstein LS, Goldstein AR, Goldstein AT. Cervical cancer screening: past, present, and future. Sex Med Rev. (2020) 8:28–37. doi: 10.1016/j.sxmr.2019.09.005 - DOI - PubMed
    1. Poddar P, Maheshwari A. Surgery for cervical cancer: consensus & controversies. Indian J Med Res. (2021) 154:284–92. doi: 10.4103/ijmr.IJMR_4240_20 - DOI - PMC - PubMed
    1. Kim JY, Jung JH, Jung S, Lee S, Lee HA, Ouh YT, et al. . Glyoxalase 1: Emerging biomarker and therapeutic target in cervical cancer progression. PloS One. (2024) 19:e0299345. doi: 10.1371/journal.pone.0299345 - DOI - PMC - PubMed

LinkOut - more resources